-
Notifications
You must be signed in to change notification settings - Fork 15
Performance Counter
Behzad Khosravifar edited this page Jun 2, 2018
·
2 revisions
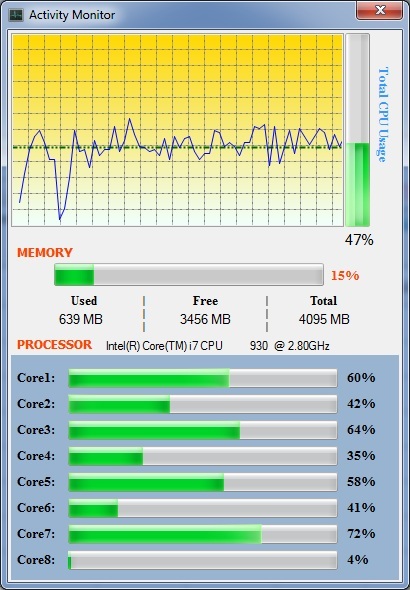
By click on "Performance Counter" in Result form, you should see this form:

In Activity Monitor you can see the how much main memory or processors are used and other useful information from system environment's. This form show as real time and graphical the top info.
- The graph shows consumption average of all processors and cores.
- Dimensions of this form based on the number of CPU cores and the number of processors is changed.
- Total amount of main memory that the program could detect 4 GB. Because that programmed for 32 Bit systems.
Copyright ©2018 [Bezzad [email protected]) All Rights Reserved.
-
Welcome
-
Features
-
Using Menu Bar
- File
- Tools
- Process Setting
