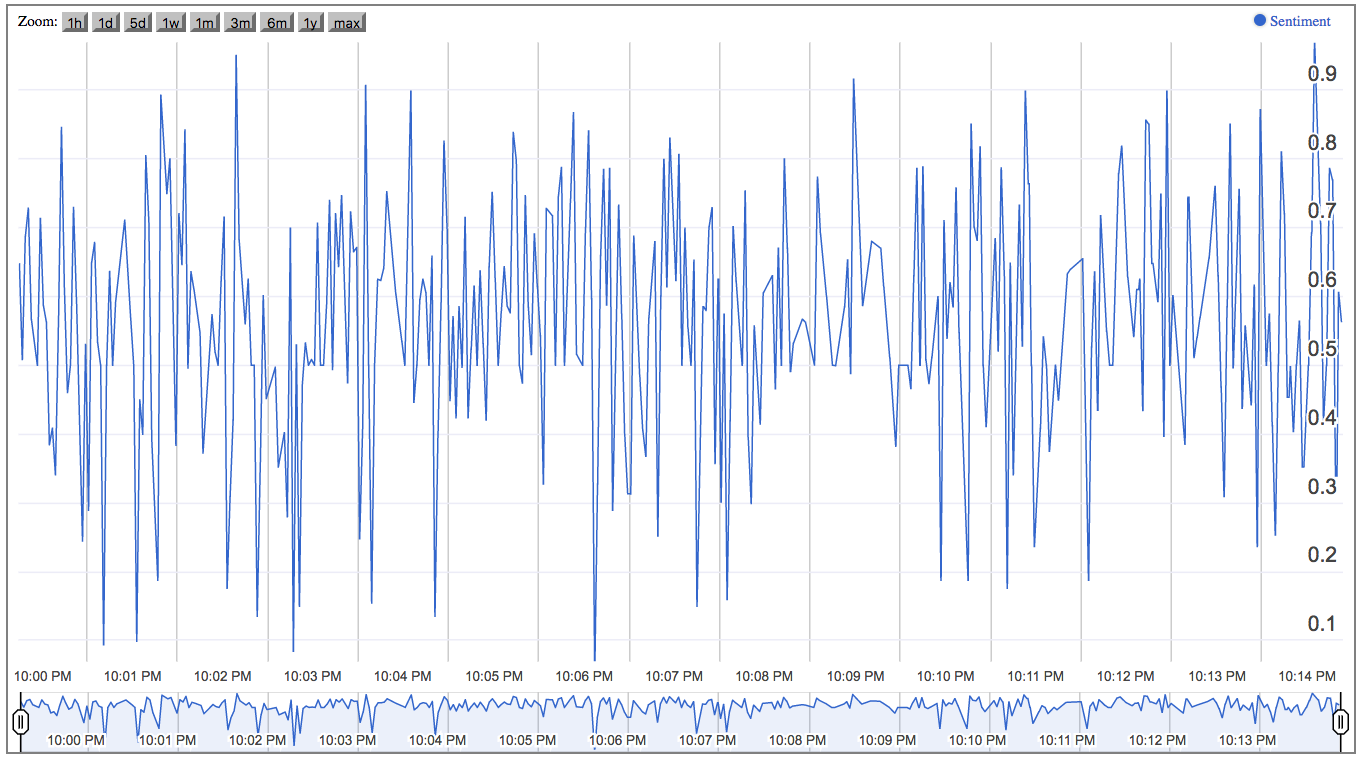
This project implements a scalable architecture to monitor and visualize sentiment against a twitter hashtag in real-time. It streams live tweets from Twitter against a hashtag, performs sentiment analysis on each tweet, and calculates the rolling mean of sentiments. This sentiment mean is continuously sent to connected browser clients and displayed in a sparkline graph.
Diagram below illustrates different components and information flow (from left to right).

Project has three parts
WebServer is a python flask server. It fetches data from twitter using Tweepy. Tweets are pushed into Kafka. A sentiment analyzer picks tweets from kafka, performs sentiment analysis using NLTK and pushes the result back in Kafka. Sentiment is read by Spark Streaming server (part 3), it calculates the rolling average and writes data back in Kafka. In the final step, the web server reads the rolling mean from Kafka and sends it to connected clients via SocketIo. A html/JS client displays the live sentiment in a sparkline graph using google annotation charts.
Web server runs each independent task in a separate thread.
Thread 1: fetches data from twitter
Thread 2: performs sentiment analysis on each tweet
Thread 3: looks for rolling mean from spark streaming
All these threads can run as an independent service to provide a scalable and fault tolerant system.
Kafka acts as a message broker between different modules running within the web server as well as between web server and spark streaming server. It provides a scalable and fault tolerant mechanism of communication between independently running services.
A separate java program reads sentiment from Kafka using spark streaming, calculates the rolling average using spark window operations, and writes the results back to Kafka.
To run the project
- Download, setup and run Apache Kafka. I use following commands on OSX from bin dir of kafka
sh zookeeper-server-start.sh ../config/zookeeper.properties
sh kafka-server-start.sh ../config/server.properties
- Install complete NLTK
- Create a twitter app and set your keys in
live_twitter_sentiment_analysis/webapp/tweet_ingestion/config.py - Install python packages
pip install -r /live_twitter_sentiment_analysis/webapp/requirements.txt
- Run webserver
python live_twitter_sentiment_analysis/webapp/main.py
- Run the maven-java project (rolling_average) after installing maven dependencies specified in
live_twitter_sentiment_analysis/rolling_average/pom.xml. Don't forget to set checkpoint dir in Main.java - open the url
localhost:8001/index.html
Here is what final output looks like in browser
Note: Tested on python 2.7 (prefered)
