-
Notifications
You must be signed in to change notification settings - Fork 0
Case study: Yippee Ki JSON
Using Yippee-Ki-JSON to show how well Abort-Mission can perform is undoubtedly not a fair fight. The reasons for this are simple:
- Yippee-Ki-JSON has only one real dependency that can have real impact on the outcome of the tests
- The concept of Abort-Mission was born from experience with Yippee-Ki-JSON tests
- I have total control on both projects at the moment, therefore I can taint the measurements
Because of these factors, please make sure to keep me honest, if you find anything improper about the contents of this page, make sure to raise it!
Yippee-Ki-JSON is a simple command line app, using Spring Boot to load and transform JSON documents into other JSON documents. Testing is done on 3 levels essentially:
- Unit tests using JUnit Jupiter and Mockito on the bottom
- Integration tests (using JUnit Jupiter and Spring Boot Test Starter, mixed together into the same run)
- System tests running the final Jar from command line, with real JSON files, just like the end user could
All of these are executed during a single Gradle build.
Test execution needs to run roughly 650 unit tests and 150 integration tests. As I have seen, Spring Boot tests try to be smart about not reloading the test context when we can avoid it, which was proven to be quite a great boost to the test execution times, as the happy case is fast enough. Unfortunately, this is not the case when the context cannot start up for whatever reason. This meant, that whenever "someone" messed up the context configuration or, some bean started to throw exceptions when they were created, there was a good chance of waiting significant time for each of the context load attempts to fail for the same reason to end up logging the same stack trace at least 150 times half a minute later.
It is understandable, that having failing tests is bad, having 150 failing tests from the same issue is unsettling. If on top of this, you needed to wait 5-10 times more, compared to a successful run, just to see the reason of this failure, you would want to find a way to avoid it too. As not messing up was never an option, I needed to look for a different solution.
I have integrated Abort-Mission, configuring a low burn-in for a single matcher targeting only the integration tests. As it is set up using a very strict config, a single countdown failure at the first execution triggers the countdown abort. This is obviously putting a lot of responsibility on the first test, but the initial results were spectacular. Afterwards, I have decided to add a match-all, report-only evaluator as well just to see the full picture in the report, despite the great track-record of the unit tests I had.
I have made a single mistake in my configuration, this time on purpose 😃, then executed the tests with the turned-off aborts (changing both evaluators to report-only), then rerun it after I restored the strict config I mentioned above.
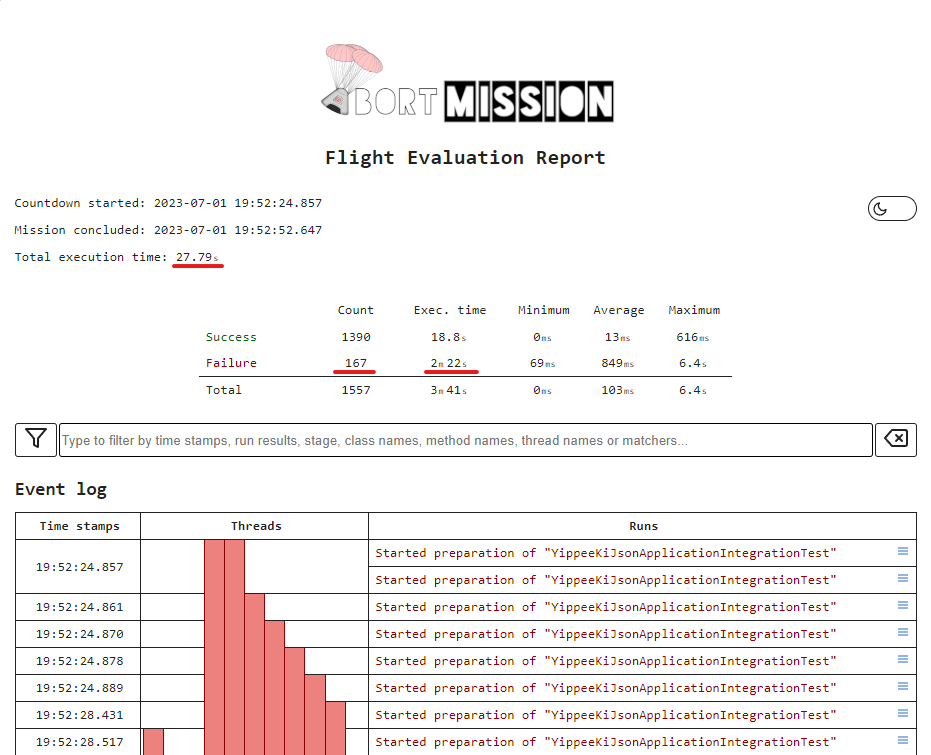
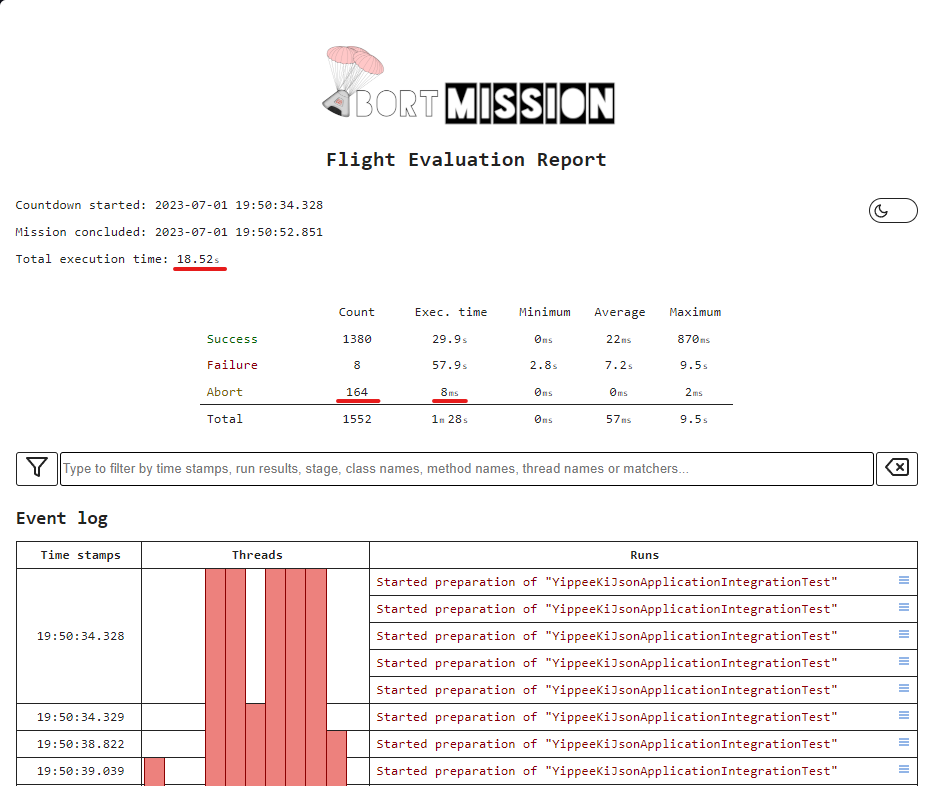
The below images show the comparison side-by-side just to show the obvious difference between the overall color changes, I will talk about the meaningful part below the diagrams.


The above pictures offer only a small part of the story, yet it makes perfect sense that the execution where Abort-Mission could skip some of the tests completed faster. Just thinking about the enormous difference between 2 minute 22 seconds and 8 milliseconds, even if it is the combined time from multiple parallel threads, it could make a significant difference.
I think the results speak for themselves, we have aborted very efficiently, in 164 cases, preventing 159 failures. This difference reduced the time spent on test execution from 27 seconds 790 milliseconds to 18 seconds 523 milliseconds. This would be already impressive, but considering the fact, that the successful unit tests took some time too, we can even say that instead of spending 9 seconds (33% of original test execution) on failing context load attempts, we have simply skipped to the results.
Of course there is a cost we paid for this. For example the 5 green tests we skipped as collateral damage. Even though, these could be probably addressed better if we spent a lot more time on fine-tuning the setup, the whole point was saving time and not spending it. At the end of the day, every developer needs to weigh up the pros and cons of a solution to find out what makes sense and what doesn't. This particular case is a win in my books.
- Full test reports
- The Yippee-Ki-JSON branch with the sabotaged context configuration
- More details about Flight Evaluation Reports