-
Notifications
You must be signed in to change notification settings - Fork 1
reporting 3.2 design
The reporting subsystem tracks usage statistics of a eucalyptus cloud, and then generates reports based upon those statistics.
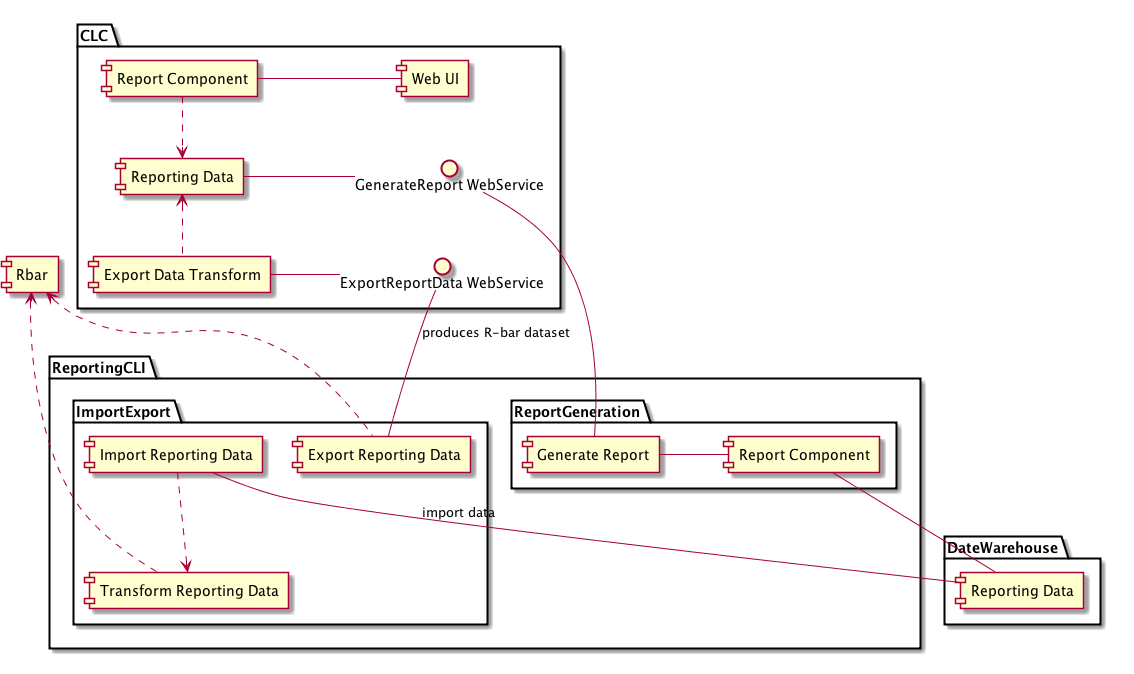
The reporting subsystem v3.2 will consist of the following main components:
The event senders and receivers will gather usage data from a running eucalyptus cloud, and will store that usage data in a database. The data stored in the database consists of: 1) entity information (for example, instance information such as instance ID, instance owner, etc); and 2) entity usage data, in a series of slices (for example, instance network usage and disk usage during a 15-second period).
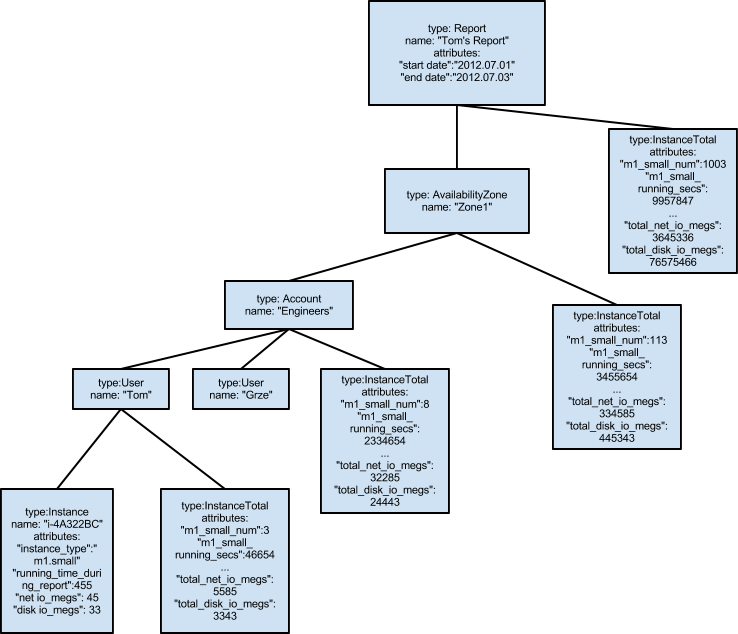
The report generator reads reporting data from the database, and performs various calculations. Those calculations consist of interpolation, grouping, summations, averages, subtractions, totals, and so on. The result is a tree structure which represents a hierarchical report. The tree structure includes nodes for "grand totals" of each user, account, etc.
The renderers take the tree representation of the report from the report generator, and render it into a horizontally-scrollable HTML document, with a table, or into a CSV document.
The Servlet or Web Service takes the rendered HTML or CSV document and exposes it to be downloaded by some external component.
The UIs gather an HTML or CSV document from the servlet or Web Service, and provide it to the user, either by displaying the document in a frame, or by saving it to a file.
The web service for exporting takes data from the database and exposes it as a platform-independent XML document which can then be used to populate another database.
The CLI tool for data export/import takes an xml document from the web service for exporting, and transforms it into a series of SQL INSERT statements for populating a data warehouse.
In all cases, reporting data flows in one direction throughout the system, starting from events fired by eucalyptus components and ending in a visual report displayed to the user. The data flow is as follows:


Each of the above numbered arrows represents an interface between components. Each of those interfaces will be specified in this design document, whereas the internal design of those components will be deferred until some later time.
The "interface" for interaction between event receivers and report generation will be a database schema/entity model. Eucalyptus components will send events based upon usage, and event receivers will populate the database based upon those events as they arrive. Then, the report generation will read that data from the database to generate a report.
Here is the ERD for the database schema:

The report generator reads data from the reporting database. Then it performs a series of calculations upon that data, like summations, averages, interpolations, and so on. Then it outputs a tree structure which is an abstract representation of a report. The tree consists of nodes, each of which has a type (a String, not a Java type), a name, a collection of attributes as name-value pairs, and a set of children nodes. For example: Each node for every user, account, group, availability zone, and report, will contain "usage total" nodes as children. Those "usage total" nodes will contain the aggregate statistics for all instances, volumes, snapshots, etc, for that entity. For example, an account node in a report of instances and volumes would contain an "instances total" child and a "volumes total" child, which contain the aggregate instance and volume usage information for all users of that account.
The renderers will take such a tree and will transform it into either an HTML document or a CSV document. An HTML document would contain a table which might look something like the following:

Containing: Instance, Volume, and elastic IP data
  1. Availability Zone: Zone1
     Instances Total: 681 m1.small instances, 4011 m1.small instance-days, ...
     Volumes Total: 443 Volumes, 61234 GB,  45 TB-days, ...
  1. Account: Engineers
     Instances Total: 112 m1.small instances, 334 m1.small instance-days, ...
     Volumes Total: 34 volumes, 335 GB, 2 TB-days
  1. User: Tom
     Instance Total: 3 m1.small instances, 4 m1.small instance-days, ...
     Volumes Total: 4 Volumes, 8 GB, 441 GB-days, ...
  1. Instance: i-4A322BC  type:m1.small time:443 seconds net: 45MB disk: 33MB
  2. Instance: i-3234343  type:m1.mediuml time:576 seconds net: 4MB disk: 2MB
  1. Volume: ...
  2. Volume: ...
  1. Instance: i-21212 type:m1.small time:222 seconds net: 33MB disk:88MB
  2. Instance: i-343434 type:m1.largel time:11 seconds net: 17MB disk: 991MB
  3. Volume: ...
  4. Bucket: ...
  5. Bucket: ...
The Renderers will provide a simple API with a stream for gathering the report in CSV or HTML format.
Interface #4: between the UIs and the servlet
The UIs will gather reporting parameters from the user and pass them to the servlet or web service.
The user will be able to select any combination of groupBy criteria from: {AvailZone,Group,Account,User}. In the GUI, this will consist of a series of checkboxes for these options. In the CLI, this will consist of a command-line option which can be specified repeatedly, for example,
./generate_report --group-by=account --group-by=user
The user will be able to select any combination of tracked statistics from: {instance,ebs,s3,elastic_ips}. In the GUI, this will consist of a series of checkboxes for these options. In the CLI, this will consist of a command-line option which can be specified repeatedly, for example,
./generate_report --include-stats=instance --include-stats=ebs
The GUI will display the resultant report in a frame, whereas the CLI will save the resultant report to a file specified by a command-line option.
(All data can be extracted from the CLC, except R8. R8 will require additional data collection metrics to be implemented and stored in the clc)
  1. Report on Total and Available compute (VM types / cores / memory / ephemeral, for example), storage (EBS and Walrus), and network (IPs, for example) capacity. (AZ level and cloud level)
  2. WTF? Total # of instances per user, type of instances, per availability zone with instance IDs
  3. WTF? Total # of hours a user has used per instance ID / instance type per availability zone
  4. Total # of elastic IPs used per user, for how long the IPs were used. This would eventually include both allocation and association times. Allocation is required, association is desired.
  5. Total # of EBS volumes, size in GiB per user per availability zone, duration used. (volume level granularity)
  6. Total # and size of snapshots in GiB per user. (with snapshot-id level granularity)
  7. Total size of Walrus storage in GiB per user. (with bucket level granularity)
  8. Per user # of PUT/GET requests, bytes In and bytes out of S3. (with bucket level granularity)
  9. Total network data transferred out per instance in # of bytes per user. (within AZ, across AZs, on the public IP)
 10. Total network data transferred in per instance in # of bytes per user. (within AZ, across AZs, on the public IP)
(All metrics and data will be collected by the Back End Team)
  1. % CPU per instance per user (CHRIS: this is a time series. graphs?)
  2. Total #of Disk Read and Write Ops per instance (CHRIS: why don't these have "per disk"?)
  3. Total #of Disk Read/Write Ops of all instances per user (CHRIS: this might be nonesense?)
  4. Total storage data read in bytes per disk per instance per user with disk type ephemeral/EBS
  5. Total storage data written in bytes per disk per instance per user with disk type ephemeral/EBS
  6. Total amount of time spent in seconds reading disks per instance per user with disk type ephemeral/EBS
  7. Total amount of time spent in seconds writing to disks per instance per user with disk type ephemeral/EBS
  8. Per user at volume level granularity - number of IO requests
category.3.2
- Contact Info
- email: [email protected]
- IRC: #eucalyptus-devel (freenode)
- Twitter: @grrrze
- Other Links