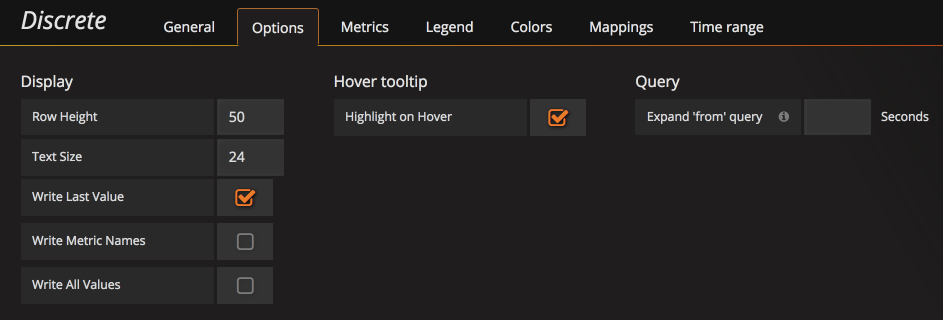
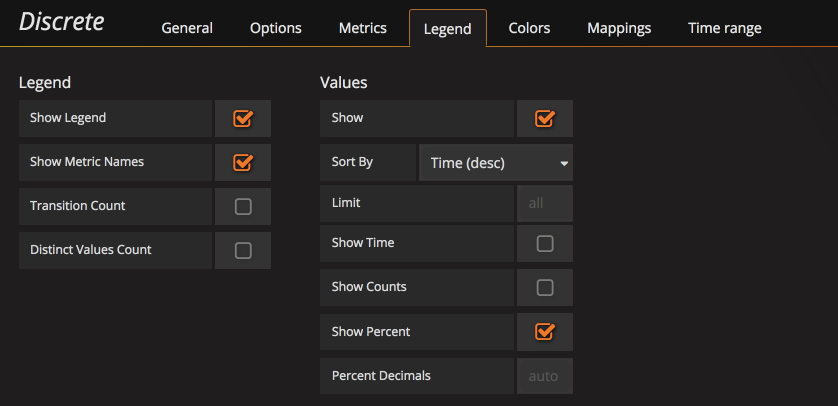
This panel shows discrete values in a horizontal graph. This lets show state transitions clearly. It is a good choice to display string or boolean data
To complie, run:
npm install -g yarn
yarn install --pure-lockfile
grunt
To Check tslint:
yarn global add tslint typescript

tslint  -c tslint.json 'src/**/*.ts'
- Switch to typescript
- Fix for grafana 4.5 (thanks @alin-amana)
- Support results from the table format
- Support results in ascending or decending order
- Configure legend percentage decimal points
- Legend can show transition count and distinct value count
- Clamp percentage stats within the query time window
- Changed the grafana dependency version to 4.x.x, since 3.x.x was not really supported
- Fixed issues with tooltip hover position
- Option to expand 'from' query so the inital state can avoid 'null'
- Support shared tooltips (not just crosshair)
- Configure more colors (retzkek)
- Fix tooltips (retzkek)
- Configure Text Size
- Support shared crosshair
- Use the panel time shift.
- First working version


