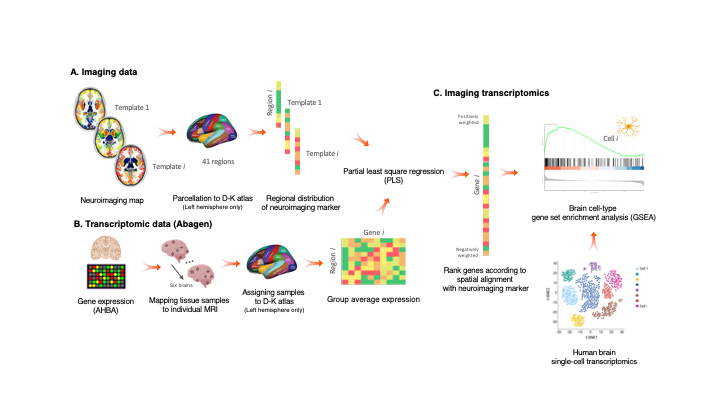
Imaging transcriptomics is a methodology that allows to identify patterns of correlation between gene expression and some property of brain structure or function as measured by neuroimaging (e.g., MRI, fMRI, PET).
The imaging-transcriptomics package allows performing imaging transcriptomics analysis on a neuroimaging scan
(e.g., PET, MRI, fMRI...).
The software is implemented in Python3 (v.3.7), its source code is available on GitHub, it can be installed via Pypi and is released under the GPL v3 license.
NOTE Versions from v1.0.0 are or will be maintained. The original script linked by the BioRxiv preprint (v0.0) is still available on GitHub but no changes will be made to that code. If you have downloaded or used that script please update to the newer version by installing this new version.
NOTE We recommend to install the package in a dedicated environment of your choice (e.g., venv or anaconda). Once you have created your environment and you have activated it, you can follow the below guide to install the package and dependencies. This process will avoid clashes between conflicting packages that could happen during/after the installation.
To install the imaging-transcriptomics Python package, first you will need to install a packages that can't be installed directly from PyPi, but require to be downloaded from GitHub.
The package to install is pypyls. To install this package you can follow the installation on the documentation for the package or simply run the command
pip install -e git+https://github.com/netneurolab/pypyls.git/#egg=pylsto download the package, and its dependencies directly from GitHub by using pip.
Once this package is installed you can install the imaging-transcriptomics package by running
pip install imaging-transcriptomicsWARNING At this time the package might some problems running on Mac computers that have the M1 chip instead of the Intel ones. The problem is not due to the package but on the chip architecture in running Python. We're currently working to test some solution for this.
Once installed the software can be used in two ways:
- as standalone script
- as part of some python script
WARNING Before running the script make sure the Pyhton environment where you have installed the package is activated.
To run the standalone script from the terminal use the command:
imagingtranscriptomics options {corr, pls}The options available are:
-i (--input): Path to the imaging file to analise. The path should be given to the program as an absolute path (e.g.,/Users/myusername/Documents/my_scan.nii, since a relative path could raise permission errors and crashes. The script only accepts imaging files in the NIfTI format (.nii,.nii.gz).-o (--output)(optional): Path where to save the results. If none is provided the results will be saved in the same directory as the input scan.-r(optional): Regions of the brain to use for the estimation. Can be either "cort+sub" (or equivalently "all") to use all regions or "cort" to use only cortical regions.--no-gsea(optional): If this option is provided the GSEA analysis will not be performed.--geneset(optional): Name of the geneset to use to run GSEA. The full list is available in the documentation or by running theimt_gsea availcommand. Additionally to the above options two specific commands (required) are available:corr: To run the correlation analysis.pls: To run the PLS analysis. If you choose to run the pls analysis there are two additional options available:--ncomp: number of components to use in the PLS analysis.--var: variance to estimate from the data.
When used as part of a Python script the library can be imported as:
import imaging_transcriptomics as imtThe core class of the package is the ImagingTranscriptomics class which gives access to the methods used in the standalone script.
To use the analysis in your scripts you can initialise the class and then simply call the ImagingTranscriptomics().run() method.
import numpy as np
import imaging_transcriptomics as imt
my_data = np.ones(41)  # MUST be of size 41
                       # (corresponds to the regions in left hemisphere of the DK atlas)

analysis = imt.ImagingTranscriptomics(my_data, method="pls", n_components=1,
                                      regions="cort+sub")
analysis.run(gsea=False)
# If instead of running PLS you want to analysze the data with correlation you can run the analysis with:
analysis = imt.ImagingTranscriptomics(my_data, method="corr",
                                      regions="cort+sub")
Once completed the results will be part of the analysis object and can be accessed with analysis.gene_results.
The import of the imaging_transcriptomics package will import other helpful functions for input and reporting. For a complete explanation of this please refer to the official documentation of the package.
The documentation of the script is available at imaging-transcriptomics.rtfd.io/.
For any problems with the software you can open an issue in GitHub or contact the maintainer) of the package.
If you publish work using imaging-transcriptomics as part of your analysis please cite:
Imaging transcriptomics: Convergent cellular, transcriptomic, and molecular neuroimaging signatures in the healthy adult human brain. Daniel Martins, Alessio Giacomel, Steven CR Williams, Federico Turkheimer, Ottavia Dipasquale, Mattia Veronese, PET templates working group. Cell Reports; doi: https://doi.org/10.1016/j.celrep.2021.110173
Imaging-transcriptomics: Second release update (v1.0.2).Alessio Giacomel, & Daniel Martins. (2021). Zenodo. https://doi.org/10.5281/zenodo.5726839


