| Last change |
|---|
v004 + header :README.md |
Here at https://github.com/bomonike/telemetry/ is an enterprise-level implementation of a telemetry system.
Telemetry is the process of collecting and transmitting “raw” data (as signals from remote sources).
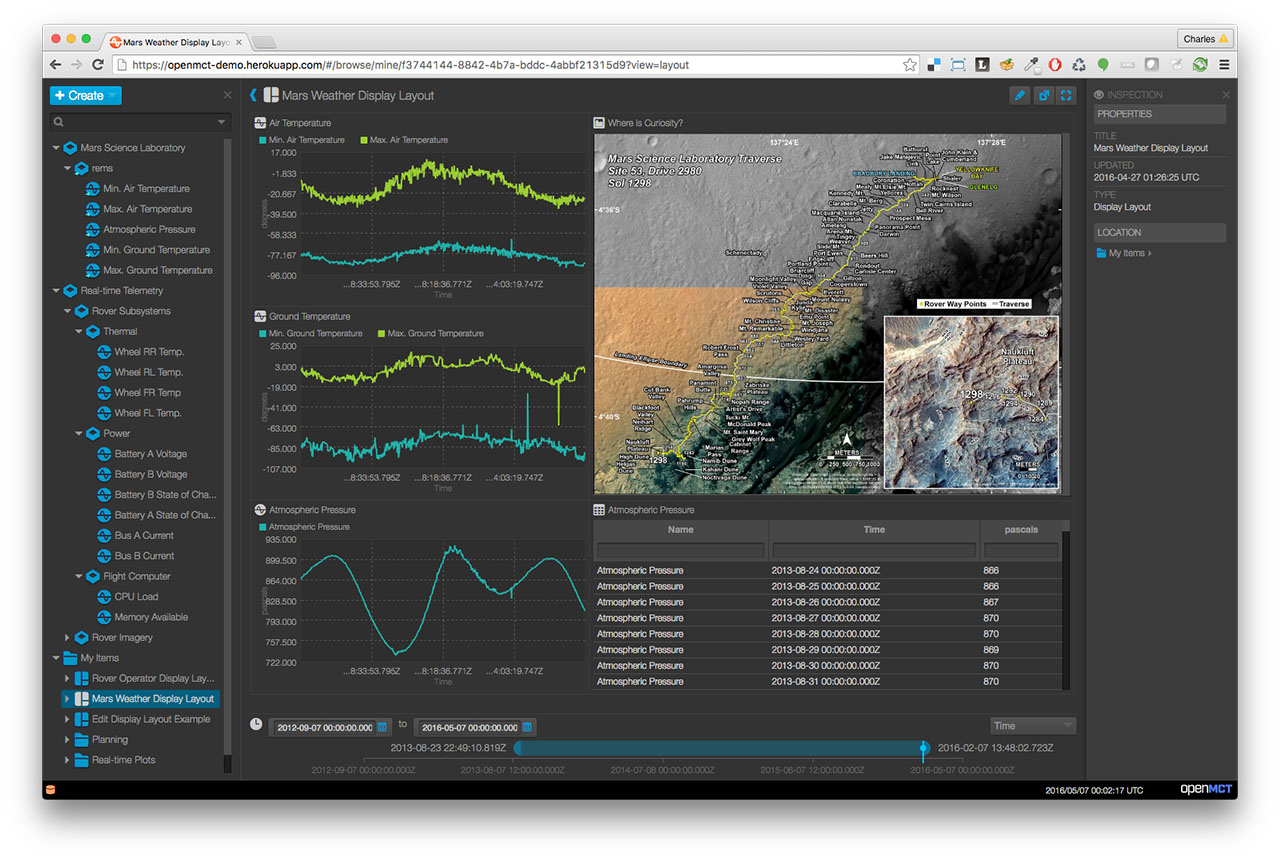
Telemetry is needed on every space mission. For example, one of the pages about the Mars Rover using NASA’s OpenMCT system: (See https://bomonike.github.io/openmct):
In the example of a robot roaming the Martian surface, mission specialists need to see:
- At the upper-right: The history of locations (path) of the craft
- Under that: individual events captured by the Collector utility
- Lines in the middle column illustrate the trend of external conditions such as air temperature, air pressure, light, etc. Not shown in this example are:
- Internal conditions such as power output from battery, battery life remaining, wheel grip (wear level on wheels)
- Alerts and Troubleshooting using Logs, Metrics, Traces
REFERENCES: “Telemetry” is not a topic listed per se in Arvix.org. However, related topics in Computer Science are: Databases, Performance, Numerical Analysis, Systems and Control, etc.
This repo was created so that a full-featured system for collecting and analyzing telemetry events can be established quickly and reliably. For example:
- Telemetry from robots running ROS2
- Telemetry from wrist bands built from a micro:bit W
Open source services are used:
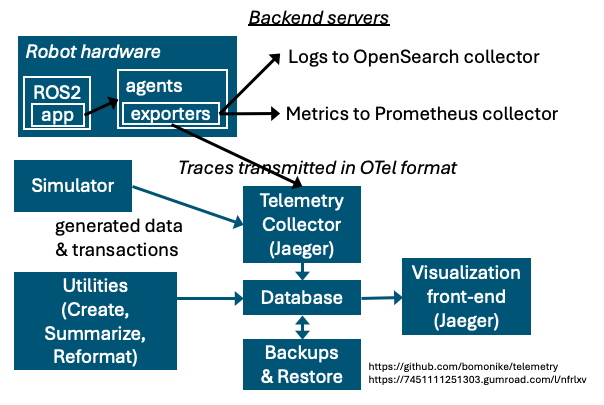
- Logs are sent to the OpenSearch collector
- Metrics are sent to the Prometheus collector
- Traces containing OpenTelemetry (OTel) instrumentation emitted from a sample Python programs are sent to a Jaeger collector
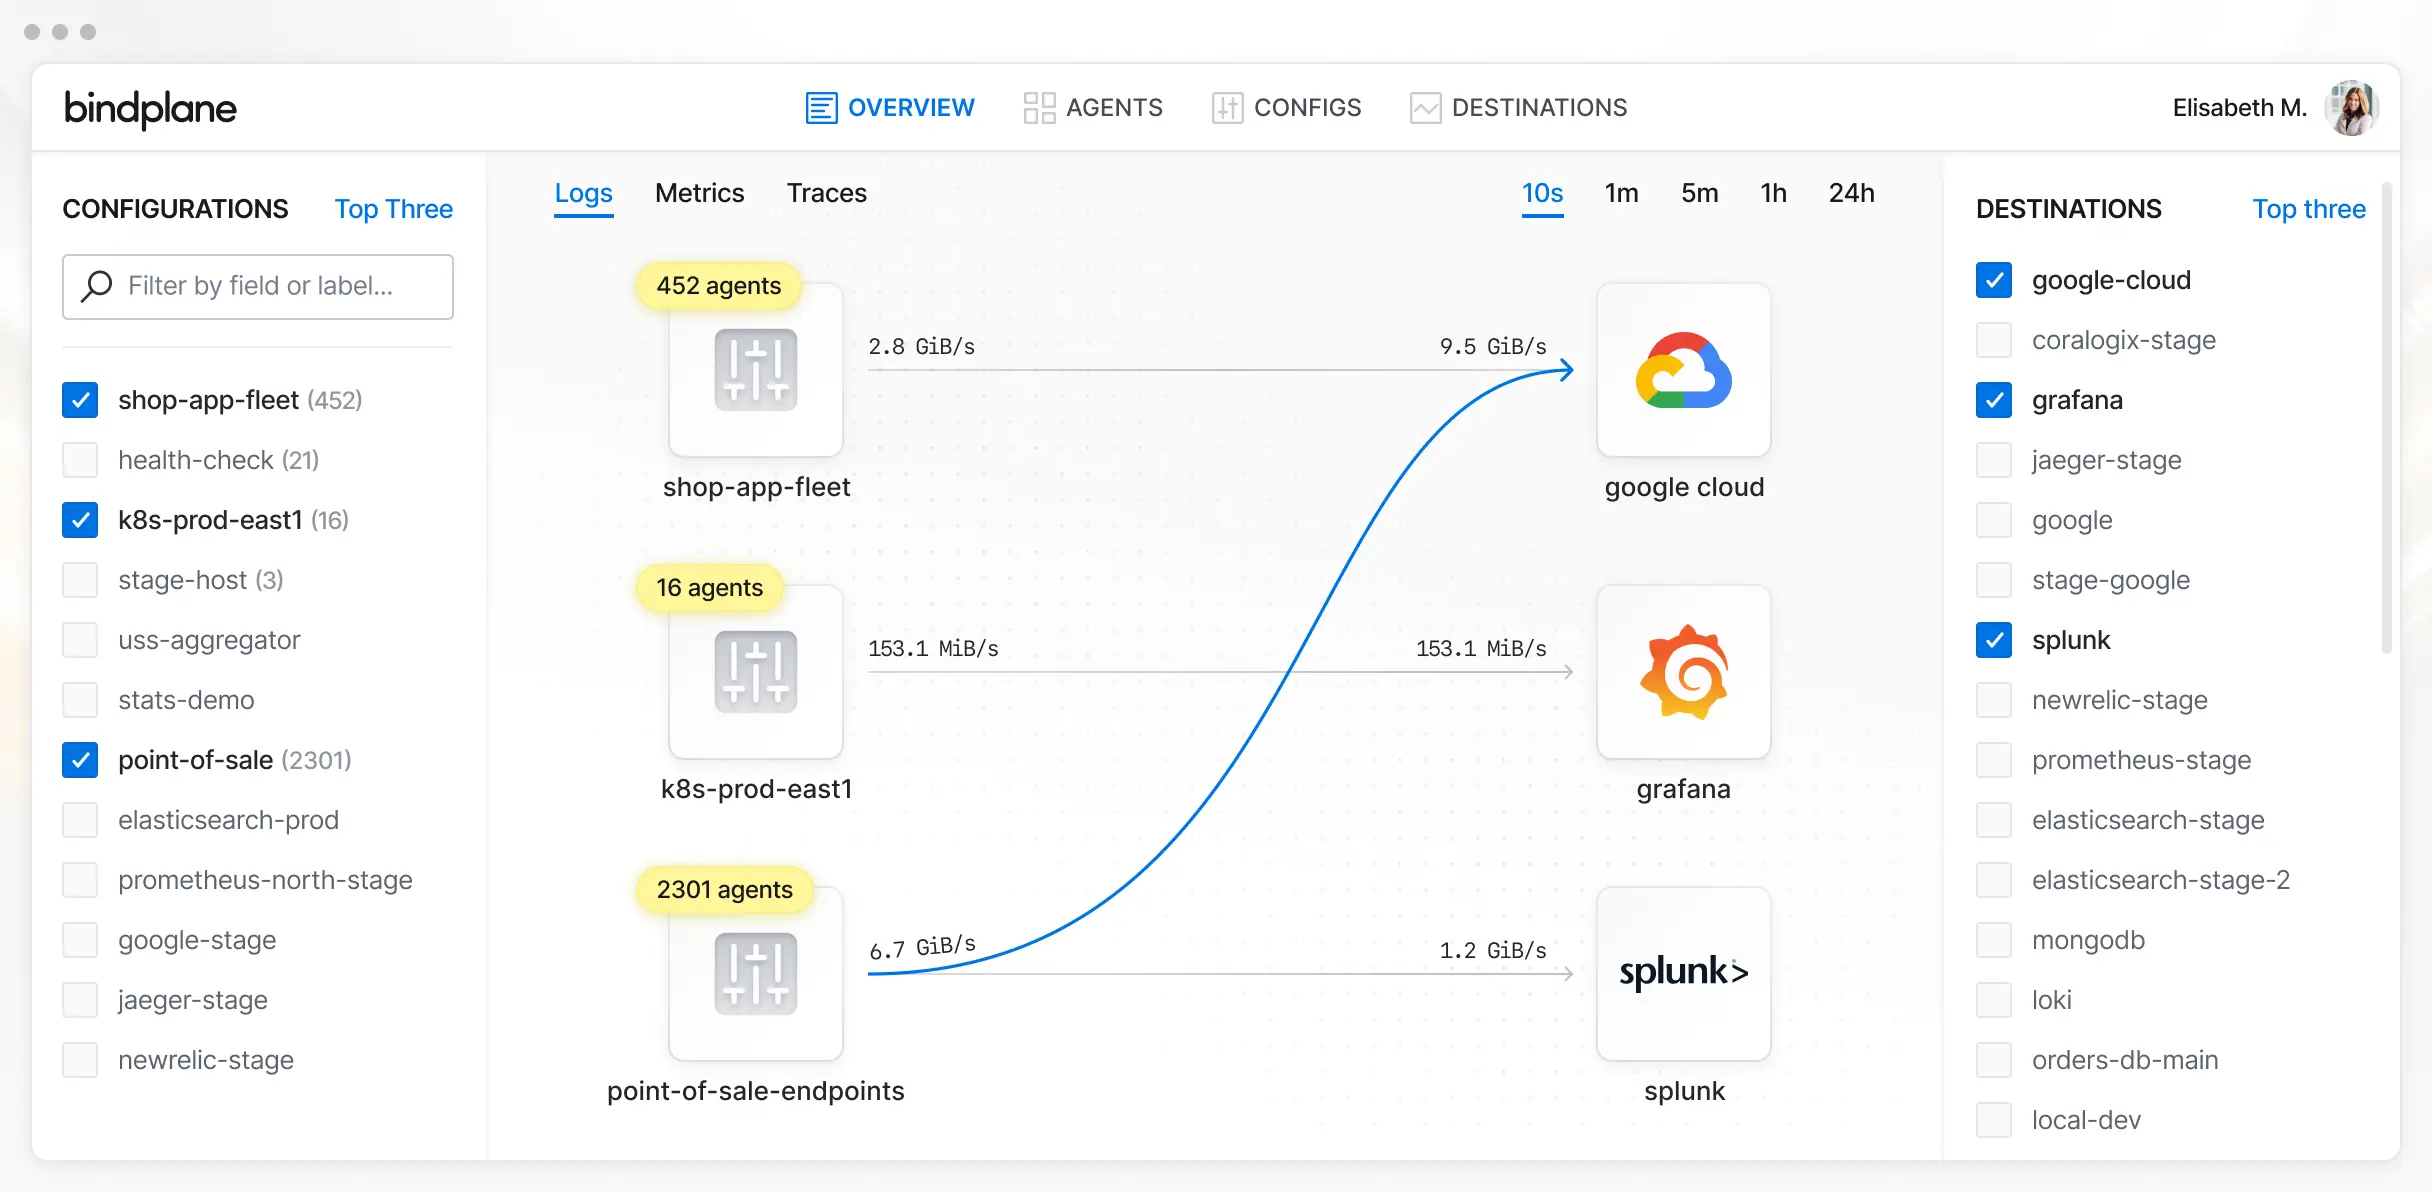
Since handling and storing emissions from every activity at high volume can be very costly, a cloud-based observiq.com can be the initial capture point to filter and consolidate data (as well as remove security issues) in a dynamic, intelligent way before forwarding them.
-
README.md: This document, which defines system components and how to install, configure, and use it.
-
LICENSE (MIT) - open sourced by Wilson Mar and others
-
.gitignore
-
setup.sh - A Bash script to setup servers using Docker Compose.
-
app.py - Sample python application containing code for OpenTelemetry tracing
-
requirements.txt - module dependencies for the pip utility to download for use by Python programs
Telemetry provides raw data for both monitoring and observability (defined below).
Monitoring is about tracking predefined metrics and logs shown on dashboards illustrating trends.
Monitoring is also called “Application Performance Monitoring (APM)”:
- "Is the service up/down?" based on uptime monitoring
- "Is it slow?" based on response duration monitoring
- “Is it stressed”? based on Server CPU/Memory usage
- “Is it working”? based on Error counts
The number of attributes about events is called its dimensionality. “Wide events” with a lot of attributes are described as having high dimensionality.
Organizations define SLIs (Service Level Indicators) to determine whether things are going well or not. Examples of “Success rate” are:
- Number of good events divided by the total number of events
- Number of requests completed successfully in 100ms or less divided by the total requests processed
Events that violate trends at predefined thresholds can be the basis for alerting about potential problems. SLOs (Service Level Objectives).
- 95% success rate over a rolling 28-day period
- 98% of requests completed successfully in 100ms or below out of total requests over a rolling 28-day period
REFERENCE: Alex Hildago’s “Implementing Service Level Objectives”.
Monitoring is a subset of Observability.
Observability uses monitoring data to understand a system's internal state from its outputs - to help debug unknown problems in user and system behavior patterns. Those outputs include multiple data sources for deep insights:
- Logs (detailed capture of system events)
- Metrics (aggregations of numeric measurements over time of infrastructure and app status)
- Traces (request flows through distributed systems) to identify root causes of issues
Perhaps this generic Python code would help to illustrate the differences:
# Telemetry: Raw data collection:
class TelemetryCollector:
	def collect_metrics(self):
    	return {
         'cpu_usage': get_cpu_usage(),
         'memory_usage': get_memory_usage(),
         'request_duration': get_request_duration(),
         'error_count': get_error_count()
    	}

# Monitoring: Predefined thresholds and alerts:
class SystemMonitor:
	def check_system_health(self, metrics):
    	alerts = []
    	if metrics['cpu_usage'] > 80:
          alerts.append("High CPU usage alert")
    	if metrics['error_count'] > 100:
          alerts.append("High error rate alert")
    	return alerts

# Observability: Complex analysis and insights:
class SystemObservability:
    def analyze_system_behavior(self, metrics, logs, traces):

        # Correlate multiple data sources:
         performance_pattern = correlate_metrics_with_traces(metrics, traces)
         error_context = analyze_error_patterns(logs, traces)
         user_impact = assess_user_impact(traces)

         # Generate insights:
         return {
            'performance_bottlenecks': identify_bottlenecks(performance_pattern),
            'error_root_causes': determine_root_causes(error_context),
            'user_experience_impact': analyze_user_impact(user_impact)
         }
By themselves, Monitoring data lacks the full context needed for efficient troubleshooting.
Monitoring is more effective for troubleshooting when they are correlated to Traces.
The above illustrates how a GET call in one service results in execution on another service the do_roll function within the rolldice class.
Beyond this, Traces typically span several system components to tell the story of how events occurring within a system flow are behaving based on custom attributes (additional information) captured along within trace data.
Observability provides the context for asking novel questions about system behavior during troubleshooting.
Common for Telemetry data collection from within apps include: OpenTelemetry (OTel, see below), StatsD, and Telegraf.
Common utilities for monitoring data collection include: Prometheus, Nagios, Zabbix, Elastic.
Lightstep is a SaaS observability back-end vendor.
Common utilities for Observability include: Grafana, Jaeger (see below), New Relic, Datadog.
https://last9.io/blog/how-to-use-jaeger-with-opentelemetry/
New Relic was an early innovator of tracing since the 1990s. They invented a protocol which was proprietary. When other vendors came on the scene, they too provided proprietary API and coding protocols. This made migrations between vendors difficult. Vendor lock-in not only increased costs but also stifled innovation.
This inspired the creation of two (competing) standards:
OpenTracing in 2015 by the Cloud Native Computing Foundation OpenCensus in 2018 by the Google Open Source Community
In 2019, the projects merged into the OpenTelemetry(OTel) project managed by CNCF to define the “best of both worlds”:
A single standard for obtaining Traces, Metrics, and Logs A single set of APIs and language-specific API SDK implementations (Python, Java, .NET, JavaScript, PHP, Go)
A part of the standard defines how data is instrumented and transmitted:
The OpenTelemetry Protocol (OTLP) specification which describes the encoding, transport, and delivery mechanism of telemetry data between telemetry sources, intermediate nodes such as collectors and telemetry backends. See it at https://opentelemetry.io/docs/specs/otlp/
Support for both legacy HTTP and real-time gRPC networking protocols Creation of shims or low-level bytecode agents for automatic instrumentation without touching app code
Ryan Goins, Product Manager at https://observiq.com/ created a series of explainer videos about Otel in 2024:
-
OpenTelemetry 101 with CEO Michael Kelly:
- 5:47 Agenda
- 06:21 What is OpenTelemetry
- 7:56 Why use OpenTelemetry
- 9:47 Stability of Signals
- 11:19 OpenTelemetry in Production Overview
- 12:27 Getting Started
- 15:56 Choosing your Collector Distribution
- 22:57 Deployment Patterns
- 28:58 Migration Strategies
- 29:55 OpenTelemetry in Production
- 33:01 Other Considerations
There are two main OpenTelemetry projects: https://opentelemetry.io/ and https://github.com/open-telemetry/opentelemetry-collector
The simplest approach to add code to generate tracing and send it to Collectors is to use Python decorators or Java annotations. Many monitoring systems use this approach to decouple tracing code from the app code.
Python decorators are functions that modify other functions or classes dynamically at runtime. Decorators “wrap” a function or class to extend its behavior without directly modifying its source code. An example is the Comet cloud collector for LLM traces shows how their decorator “@optik.track” put in front of each function would cause the result and other metadata to be sent to a collector.
@opik.track   # decorator
def my_llm_chain(input_text):
	# Call the different parts of my chain
	return “Hello, world!”
The code is installed by:
pip install optik
and configured by:
import opik
opik.configure()
The above sets up where the decorator code sends its information.
REFERENCE: https://www.comet.com/docs/opik/quickstart/
https://www.comet.com/docs/opik/tracing/integrations/overview/ lists integrations with many LLMs with APIs, accessed from within Google Colab:
- OpenAI
- OpenAI LiteLLM
- LangChain
- Anthropic
- Bedrock
- LangGraph
- LlamaIndex
- Ollama
- Predibase
- Ragas evaluation framework for your Retrieval Augmented Generation (RAG) pipelines
- Watsonx (from IBM)
- Download: If you did not Fork the repo:
git clone https://github.com/bomonike/telemetry.git cd telemetry - Install dependencies:
python3 -m venv venv  # venv is in .gitignore
source venv/bin/activate
pip install -r requirements.txt
FIXME:
ERROR: Could not find a version that satisfies the requirement opentelemetry-exporter-jaeger==1.23.0 (from versions: 0.12b0, 0.13b0, 0.14b0, 0.15b0, 0.16b0, 0.16b1, 0.17b0, 1.0.0rc1, 1.0.0, 1.1.0, 1.2.0, 1.3.0, 1.4.0, 1.4.1, 1.5.0, 1.6.0, 1.6.1, 1.6.2, 1.7.0, 1.7.1, 1.8.0, 1.9.0, 1.9.1, 1.10.0, 1.11.0, 1.11.1, 1.12.0rc1, 1.12.0rc2, 1.12.0, 1.13.0, 1.14.0, 1.15.0, 1.16.0, 1.17.0, 1.18.0, 1.19.0, 1.20.0, 1.21.0)

[notice] A new release of pip is available: 24.2 -> 24.3.1
[notice] To update, run: pip install --upgrade pip
ERROR: No matching distribution found for opentelemetry-exporter-jaeger==1.23.0
-
Ensure that ports in the command are open.
docker run -d --name jaeger \ -e COLLECTOR_ZIPKIN_HOST_PORT=:9411 \ -p 5775:5775/udp \ -p 6831:6831/udp \ -p 6832:6832/udp \ -p 5778:5778 \ -p 16686:16686 \ -p 14250:14250 \ -p 14268:14268 \ -p 14269:14269 \ -p 9411:9411 \ jaegertracing/all-in-one:1.22 -
Run the above to start Jaeger (using Docker):
FIXME:
Status: Downloaded newer image for jaegertracing/all-in-one:1.22
WARNING: The requested image's platform (linux/amd64) does not match the detected host platform (linux/arm64/v8) and no specific platform was requested
46d09c080ab6d9b56e74ec8fc64bf90113591dbc1858aee0af9fae6283e16e48
Jaeger stores trace data in scalable backends like Cassandra or Elasticsearch.
-
Run the application:
chmod +x app.py python app.py -
Send a test order:
curl -X POST http://localhost:5000/order \
-H "Content-Type: application/json"
-d '{
"order_id": "12345",
"amount": 100.00,
"customer_id": "cust_123",
"product_id": "prod_456",
"quantity": 2,
"payment_method": "card",
"type": "express"
}'
8. Check health endpoint:
curl http://localhost:5000/health
9. Open Jaeger UI to view traces:
openhttp://localhost:16686
9. Select "order_service" from the Service dropdown

Jaeger provides a UI: Web interface for data visualization and analysis.

10. Click "Find Traces" to view recorded traces


## Trace Analysis

The example creates several types of spans:

1. **create_order_api**
- Root span for order creation
- Contains order type and customer ID

2. **process_order**
- Child span for order processing
- Includes order ID and amount
- Records processing events

3. **process_payment**
- Represents payment processing
- Tracks payment amount and method
- Records success/failure

4. **update_inventory**
- Handles inventory updates
- Tracks product ID and quantity

## Best Practices Demonstrated

1. **Proper Span Naming**
- Clear, descriptive names
- Follows service naming conventions

2. **Error Handling**
- Sets appropriate span status
- Records exceptions
- Maintains error context

3. **Attribute Usage**
- Business-relevant attributes
- Consistent naming
- Appropriate value types

4. **Event Recording**
- Meaningful event names
- Relevant event attributes
- Proper timestamps

5. **Context Propagation**
- Automatic HTTP propagation
- Maintains trace continuity
- Preserves parent-child relationships


### Telemetry Event JSON

Each error is a captured as an event – a structured, time-stamped representation of a system action, such as this JSON example:

<img src="https://res.cloudinary.com/dcajqrroq/image/upload/v1732092863/otel-span_iozoay.png" />


## Python app.py

Below is a description of how to setup Jaeger to receive OpenTelemetry (otel) instrumentation emitted from a sample Python program.

The Python program emits telemetry with attributes that span several events with Parent-child relationships. Context propagation. Error handling and status tracking.


## OpenTelemetry Collector Jaeger

Technical components of telemetry described below consist of the following:

Jaeger was originally created within Uber Technologies as an open-source project and since is a graduated project of the Cloud Native Computing Foundation (CNCF). So the project benefits from CNCF’s unified set of APIs, libraries, agents, and protocol specifications. It also offers strong integration with Kubernetes and other cloud-native technologies. Semantic conventions  ensure consistency in metric data representation and interpretation.

Jaeger is an open-source distributed tracing system designed for monitoring and troubleshooting microservices-based distributed systems.

OpenTelemetry provides auto-instrumentation for various languages, including Java, Python, Go, .NET, and more.

To setup a Jaeger observability server to run using Flask on a macOS machine we call the “backend” a summary is:

1. Install dependencies from requirements.txt
1. Start Jaeger (instructions in README)
1. Run the Flask application
1. Send test requests
1. View traces in Jaeger UI

“Distributed Tracing” (or tracing for short) is a method of tracking the progression of a single request – called a trace – as it is handled by various services that make up an application.


https://www.instagram.com/p/DAYvvvQKEdT/?hl=en
LUNA Analog Facility is a pioneering facility for preparing future astronautical and robotic lunar missions. LUNA enables the realization of highly complex simulations for these activities, thus adding a decisive building block to the global infrastructure preparing humans’ return to the lunar surface as part of the Artemis program.

## Robotic companies

Robotics is a global market:
https://www.f6s.com/companies/robotics/germany/co

## Jobs within robotics companies
There are actual jobs listed to work on telemetry within Robotics companies.
Such jobs have titles such as “Reliability and Performance Engineer”.

“Reliability and Performance” Engineer Job listing [R]
* NVIDIA
* Tesla

## References
This is a collaborative effort under social media channels named “TelemetryTeam” on GitHub, LinkedIn, YouTube, Discord, Substack, Medium, X, Facebook, Instagram, TikTok, etc.

Podcast: “API Monitoring and Observability for Backend Engineers”  https://creators.spotify.com/pod/show/gbe/episodes/API-Monitoring-and-Observability-for-Backend-Engineers-e2m077i
https://www.instagram.com/p/DAYvvvQKEdT/?hl=en


