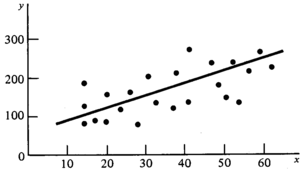
Analyze data and try to find a significant trend.
Imagine you're looking at points in a graph and you want to draw a single line through the points that represents their change. This is what Trend Calculator does. It tells you if there is a line through the points and how steep it is.
This class takes as an input a series of data points in time, performs regression, determines its statistical significance and returns a trend.
Time is the independent/explanatory variable, values are the dependent/outcome/target variable. In simplest terms:
"How does value change in time?"
Install Trend Calculator with the PHP package manager, Composer:
composer require revisor/trend$trendCalculator = new TrendCalculator();
/**
* $data is an array of arrays
* In the inner arrays, keys are a time value in any unit (seconds, ie.
* timestamp, microseconds, days, weeks...), the values are data values.
* Multiple values for one point in time are allowed - maybe two events
* occurred at one time.
*/
$data = [
[1 => 9],
[1 => 5],
[2 => 12],
[4 => 7]
];
/**
* The resulting trend is a negative or positive float, or zero.
*
* Values other than zero mean that there is a significant trend in the provided
* data, and the trend goes down (for a negative number) or up (for a positive number).
*
* If the value is zero, it means that there is no significant trend.
*/
$trend = $trendCalculator->calculateTrend($data);The slope of the trend is calculated by mcordingley/Regression.
You can access more information about your data by asking the regression itself.
$regression = $trendCalculator->getRegression();
var_dump($regression->getStandardErrorCoefficients());Please see the CHANGELOG for more information what has changed recently.
Please see CONTRIBUTING for details.
The MIT License (MIT). Please see the License for more information.


