dnstap_reader contains developing software for read dnstap data (from file or socket) and send it to syslog (or logstash).
root@dns2:~/dnstap_reader# ./dnstap2logstash.py
error: the following arguments are required: -d/--dest-host, -p/--dest-port
usage: dnstap2logstash.py [-h] [-v] [-c] -d DEST_HOST -p DEST_PORT
                          [-t LOG_TYPE] [-l] (-f FILE | -s SOCKET)

DNSTAP reader to logstash

optional arguments:
  -h, --help            show this help message and exit
  -v, --verbose         Verbose log all query
  -c, --cut             Cut multiple <answers> to single event
  -d DEST_HOST, --dest-host DEST_HOST
                        logstash host
  -p DEST_PORT, --dest-port DEST_PORT
                        logstash port (udp)
  -t LOG_TYPE, --log-type LOG_TYPE
                        Type log [json|cef] (json default)
  -l, --to-syslog       Send copy of output to local syslog
  -f FILE, --file FILE  file
  -s SOCKET, --socket SOCKET
                        socket
Default mode parse only Client Response (CR), use -v for show all dns query
root@dns2:~/dnstap_reader# ./dnstap2passivedns.py
error: one of the arguments -f/--file -s/--socket is required
usage: dnstap2passivedns.py [-h] [-m] [-d] [-v] [-l | -o]
                            (-f FILE | -s SOCKET)

DNSTAP reader to passivedns log format

optional arguments:
  -h, --help            show this help message and exit
  -m, --mnemonics       Mnemonics datatype (help)
  -d, --debug           Debug mode
  -v, --verbose         Verbose mode
  -l, --to-syslog       Send output to syslog (demonize)
  -o, --outfile         Send output to file (demonize)
  -f FILE, --file FILE  file
  -s SOCKET, --socket SOCKET
                        socket
Default mode parse only Client Response (CR), use -v for show all dns query
Read this
(from https://www.vanimpe.eu/2018/12/27/dnstap-for-improved-dns-logging-on-ubuntu/)
DNS logging and monitoring is important! Monitoring DNS logs allows you to analyze and detect C&C traffic and have access to crucial information to reduce the dwell time and detect breaches. Combined with Passive DNS it’s a very valuable data source to be used during incident response.
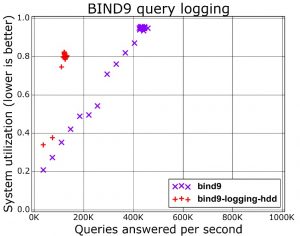
But DNS logging comes at a price. Every log operation requires the system to write out an entry to disk (besides also properly formatting the log string). This is a slow I/O-operation and limits the maximum amount of queries that your system can answer. A graph (https://www.vanimpe.eu/wp-content/uploads/2018/12/bind9-300x236.jpg) from a presentation from Farsight Security shows the difference of running BIND9 with or without query logging.
Another way of capturing DNS logs is via packet capture. This is a good solution if you do not have direct access to the DNS server. If you manage the DNS server then doing packet capture is not the most efficient solution though. Packet capture is in essence re-doing the same stuff as the things your DNS server is already doing, for example packet reassembly and session management. Although this approach makes it more difficult to tie individual responses to queries, as default query logging doesn’t log the responses it’s your best best to keep track of the DNS answers (for example via Bro) based on your traffic.
All this will probably not be a big issue in smaller environments but if you scale up there will be a time when you hit the system limits. Does this mean you should then give up on DNS logging? Not at all!
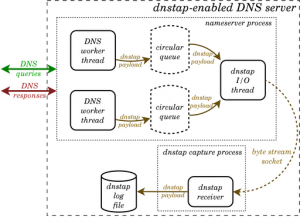
An alternative to DNS query logging is dnstap. Dnstap is a flexible, structured binary log format for DNS software that uses Protocol Buffers to encode events in an implementation-neutral format. Dnstap exists for most open source DNS servers as Bind, Knot and Unbound. The major advantage of Dnstap is demonstrated via its architecture schema.
The encoding of events and writing to disk happens outside the DNS handling system on a “copy” of the DNS message. This means that slow disk performance during log operations will have less of a negative impact on the system as a whole. The generation of the messages is done from within the DNS handling system, meaning that all relevant DNS information can be included and does not need to be reconstructed from observing the traffic.
Speed isn’t the only advantage of dnstap. In case of a very high load or peak, the system can start dropping the log messages but still process the queries. Additionally, the logged information contains all the details of the request making it a treasure-cave for future research.
I added logstash configuration for SOF-ELK platform.
Query Direction:
  AQ: AUTH_QUERY (type: 1)
  AR: AUTH_RESPONSE (type: 2)
  RQ: RESOLVER_QUERY (type: 3)
  RR: RESOLVER_RESPONSE (type: 4)
  CQ: CLIENT_QUERY (type 5)
  CR: CLIENT_RESPONSE (type: 6)
  FQ: FORWARDER_QUERY (type: 7)
  FR: FORWARDER_RESPONSE (type: 8)
  SQ: STUB_QUERY (type: 9)
  SR: STUB_RESPONSE (type: 10)
  TQ: TOOL_QUERY (type: 11)
  TR: TOOL_RESPONSE (type: 12)

Flags description:
  QR: Query Response
  AA: Authoritative Answer
  TT: Truncated Response
  RD: Recursion Desired
  RA: Recursion Avaible
  AD: Authentic Data
  CD: Checking Disabled

RCODE description:
   NOERROR = 0
   FORMERR = 1
   SERVFAIL = 2
   NXDOMAIN = 3
   NOTIMP = 4
   REFUSED = 5
   YXDOMAIN = 6
   YXRRSET = 7
   NXRRSET = 8
   NOTAUTH = 9
   NOTZONE = 10
   BADVERS = 16


