-
Notifications
You must be signed in to change notification settings - Fork 55
Viewing HRF in Probe Space
yileizheng-BU edited this page Apr 26, 2020
·
3 revisions
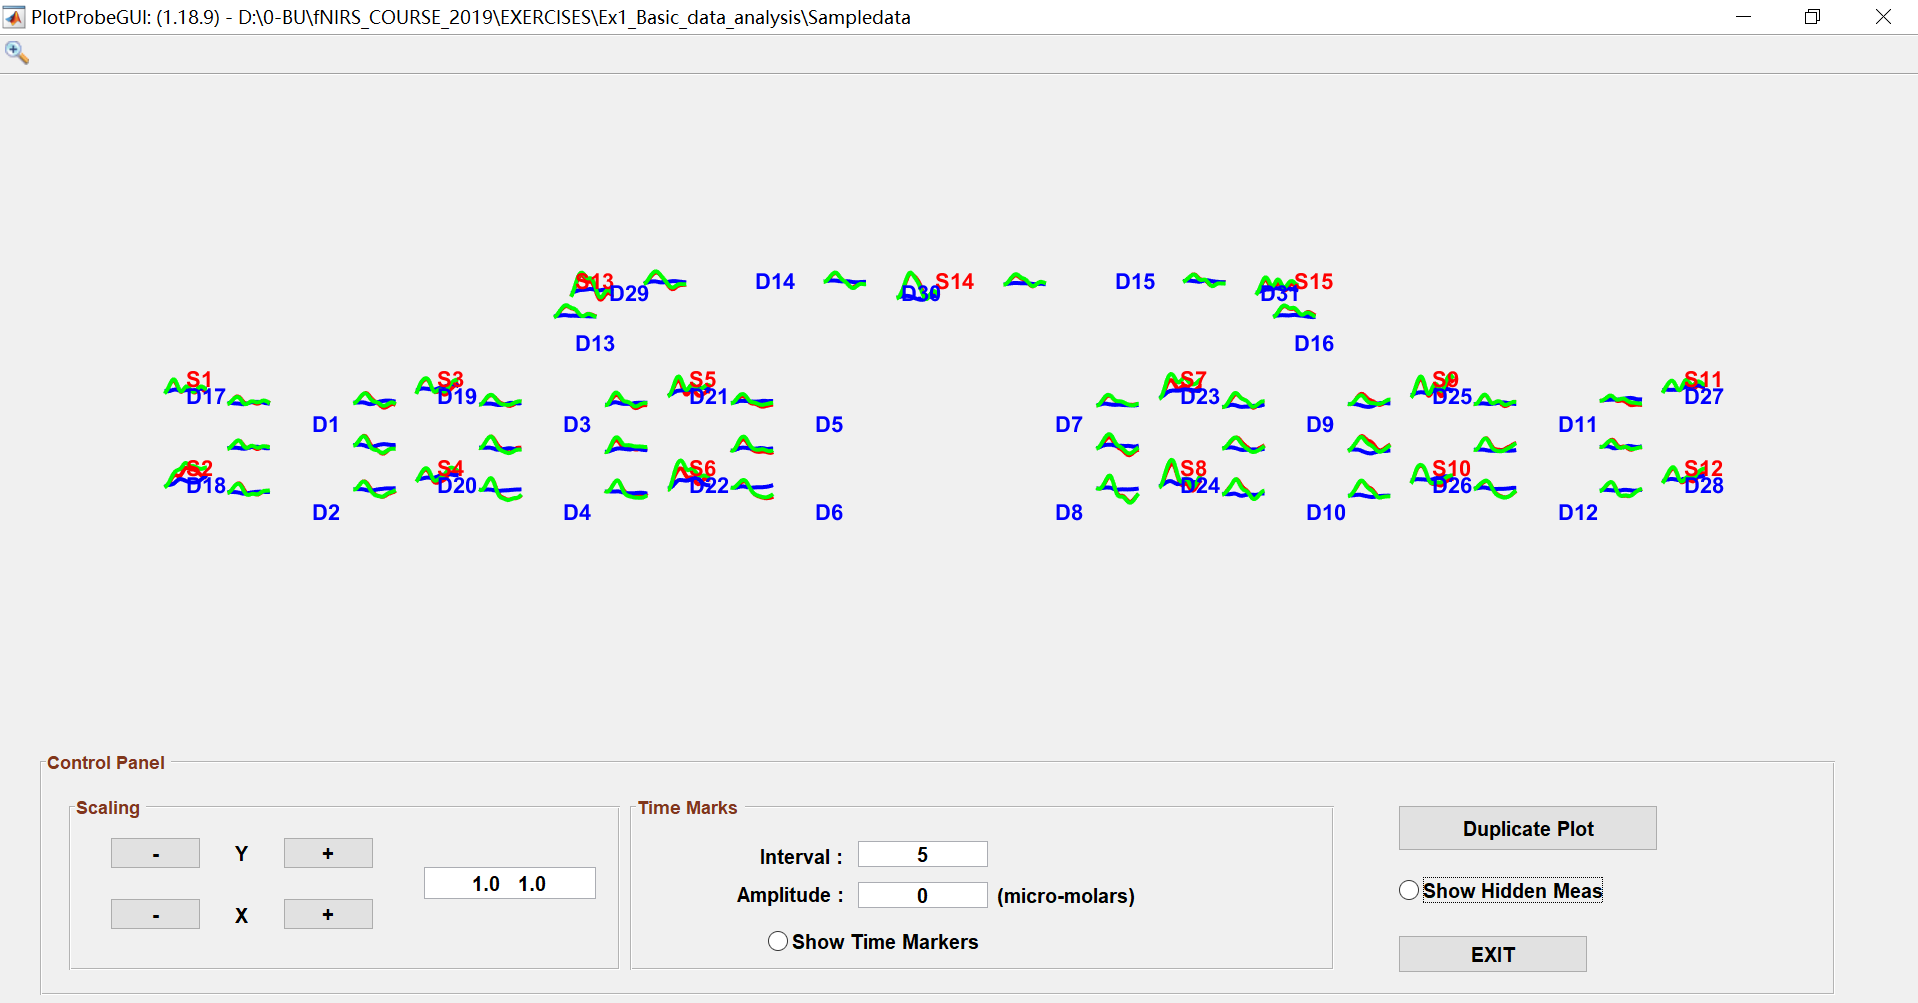
The PlotProbeGUI allows the user to view the HRF in probe space after data has been processed.
To open the PlotProbeGUI, first select an element (you can select a run, subject or group) and select a condition, then go into the Tools menu and select the Plot Probe.

In the PlotProbeGUI, the HRFs of all channels are displayed in probe space. The green, blue and red curve represents HbO, HbR and HbT, respectively.

You can also scale the data, view time markers and amplitude, display pruned channel data, and copy the figure by using the Control Panel.

- To scale the HRF figures, click the + or – to adjust the range of X and Y axes OR directly enter the scale value in the right edit box.
- To view time markers, set Interval time and Amplitude, then click the Show Time Markers radio button. The time markers will be displayed in black vertical lines.
- To view pruned channel data, click the show Hidden Measurements radio button and the HRF of pruned channels will be presented in dashed curves.
- To copy the plot, click the Duplicate Plot button and save the figure from the pop-up window.
- Click the EXIT to exit the PlotProbeGUI.
Join the Homer3 community on openfnirs.org!
- Homer3 Overview
- Download and Installation
- Homer3 Graphical User Interfaces
- Input and Output Definitions
- Processing Data
- Viewing Processed Data via GUI
- Exporting Processed Data into a Text File
- Exporting Processed Data into MATLAB WorkSpace
- Working with Datasets using DataTree Library
- Working with SNIRF files standalone
- Custom User Functions