-
Notifications
You must be signed in to change notification settings - Fork 113
Animating Pyplot Matplotlib Graphs
Pier Paolo Ippolito edited this page Apr 25, 2020
·
1 revision
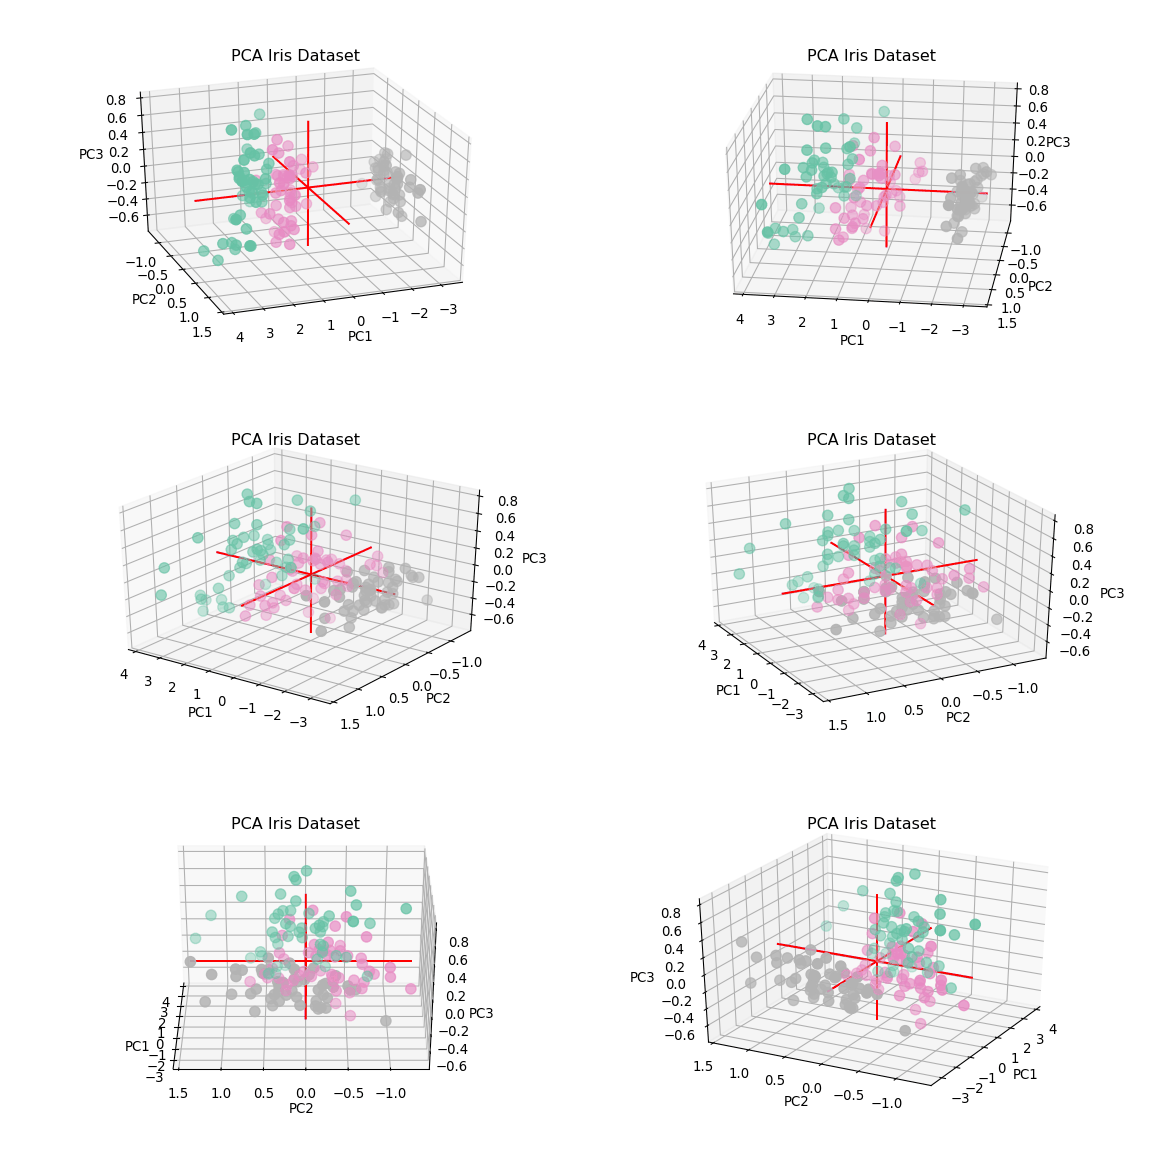
Matplotlib is probably Python most known Data Visualization library. By creating a plain plot and then saving a multitude of Matplotlib figures while varying the angle of observation from the axis (and finally combine the different pictures in a GIF), plain Matplotlib can be used in order to create amazing animations.
Another possible way to make animated graphs in Matplotlib can be to use the Matplotlib Animation API. This API can allow as to make some simple animations and live graphs. Some examples can be found here.
A multitude of coding example about how to create interactive plots using Matplotlib is available at the following links: Link 1, Link 2.

Pier Paolo Ippolito - Copyright © 2020
