##
## Attaching package: 'cowplot'

## The following object is masked from 'package:ggplot2':
##
##     ggsave
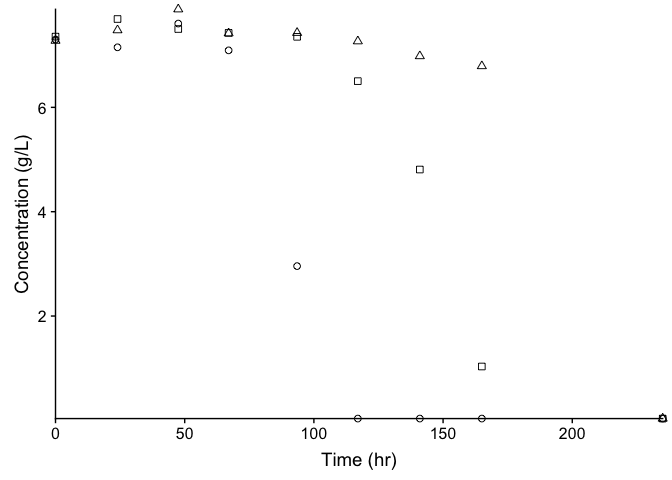
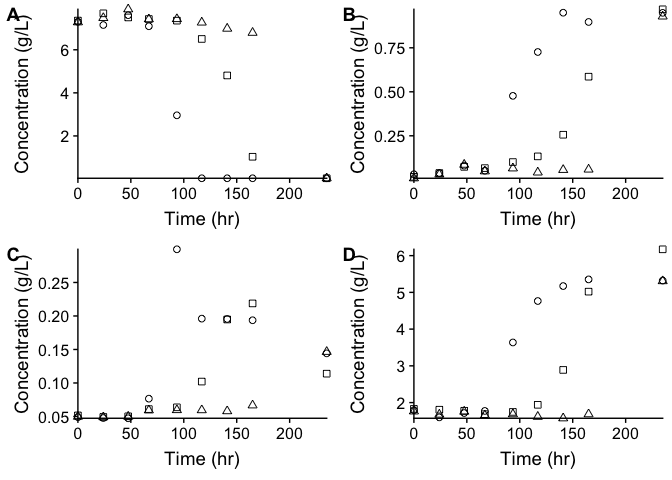
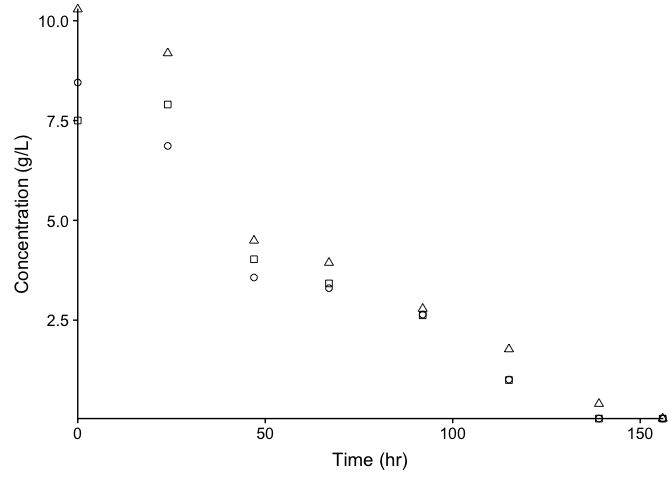
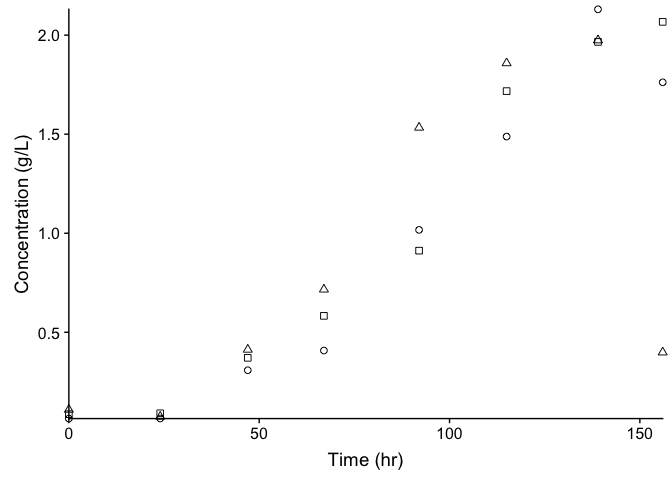
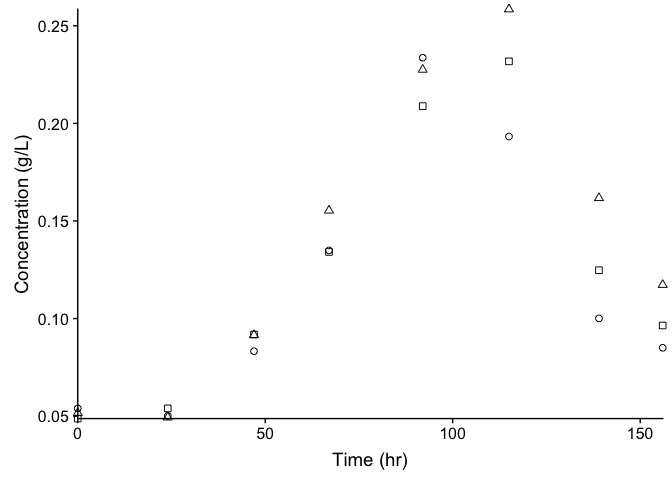
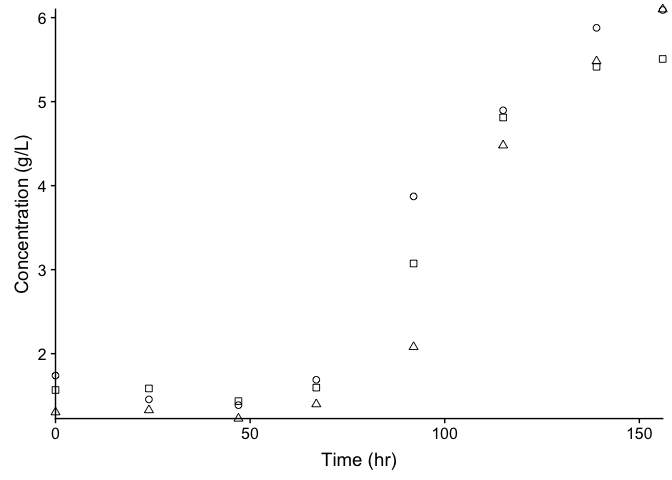
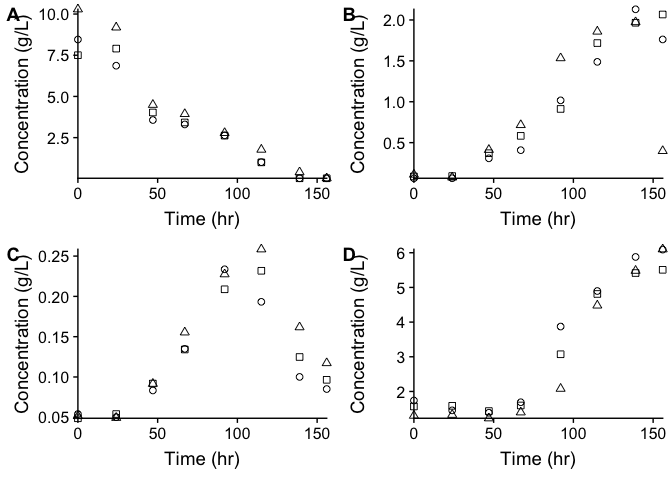
##       Trial Hours Fermentation Compound Area_type Concentration
## 1  coFerm_1   0.0            1  Glucose       RID    7.35624672
## 2  coFerm_1  24.0            1  Glucose       RID    7.69354599
## 3  coFerm_1  47.5            1  Glucose       RID    7.50193358
## 4  coFerm_1  67.0            1  Glucose       RID    7.42709057
## 5  coFerm_1  93.5            1  Glucose       RID    7.35232350
## 6  coFerm_1 117.0            1  Glucose       RID    6.50268041
## 7  coFerm_1 141.0            1  Glucose       RID    4.80848659
## 8  coFerm_1 165.0            1  Glucose       RID    1.03276442
## 9  coFerm_1 235.0            1  Glucose       RID    0.03469543
## 10 coFerm_1   0.0            2  Glucose       RID    7.29952966
## [1] "Trial"         "Hours"         "Fermentation"  "Compound"
## [5] "Area_type"     "Concentration"
## 'data.frame':    722 obs. of  6 variables:
##  $ Trial        : Factor w/ 10 levels "coFerm_1","coFerm_2",..: 1 1 1 1 1 1 1 1 1 1 ...
##  $ Hours        : num  0 24 47.5 67 93.5 117 141 165 235 0 ...
##  $ Fermentation : Factor w/ 8 levels "1","2","3","4",..: 1 1 1 1 1 1 1 1 1 2 ...
##  $ Compound     : Factor w/ 5 levels "Acetic Acid",..: 2 2 2 2 2 2 2 2 2 2 ...
##  $ Area_type    : Factor w/ 2 levels "RID","UV": 1 1 1 1 1 1 1 1 1 1 ...
##  $ Concentration: num  7.36 7.69 7.5 7.43 7.35 ...