-
Notifications
You must be signed in to change notification settings - Fork 8
Tracking Tutorial
- Tutorial Overview
- Setting Video Input
- Detect ROIs
- Manually Edit ROIs (optional)
- Initialize Background Reference
- Sample Tracking
- Setting mm unit conversion (optional)
- Set Experiment Options
- Start Tracking
This tutorial will use the following sample video to demonstrate basic setup, parameter tweaking, and some of MARGO's utilities for a simple tracking experiment:
./margo/examples/sample_videos/singletrack_48arena_high_contrast.mp4
The workflow in MARGO will generally work top to bottom through the GUI. The controls will be progressively enabled to enforce the correct workflow. Refer to the image below at any time as a quick reminder of the mandatory GUI workflow.

For this tutorial we will use sample video file provided with MARGO. See video inputs for additional details on initializing a camera or video file input.
1. MARGO defaults the video input source to camera. Switch the image input source to video

2. Click select files and browse to the sample video provided

3. Preview the video file by clicking Start Preview
In this section we will divide the video into regions of interest (ROIs) for MARGO to track. MARGO conducts tracking separately for each ROI. The goal is to assign each arena to a separate ROI so that MARGO can maintain the identity of each fly during tracking by identifying which ROI it occupies. We can define a grid of ROIs manually (as demonstrated below) or automatically detect ROIs with image segregation. See ROI detection for additional details on ROI detection modes and parameters.
Grid ROI detection
1. Initiate ROI detection by clicking Detect ROIs

2. Click and drag a rectangle in the preview window to place a new ROI grid
3. Edit the number of rows and columns to match the dimensions of the arenas (6 x 8)

4. If necessary, adjust the positions of the individual grid corners (lower left corner of the grid is adjusted in the example below)

5. At this point we could place additional grids by selecting the (+) control button, but a single grid will work for this example. Click *Accept* to confirm the location of ROIs.

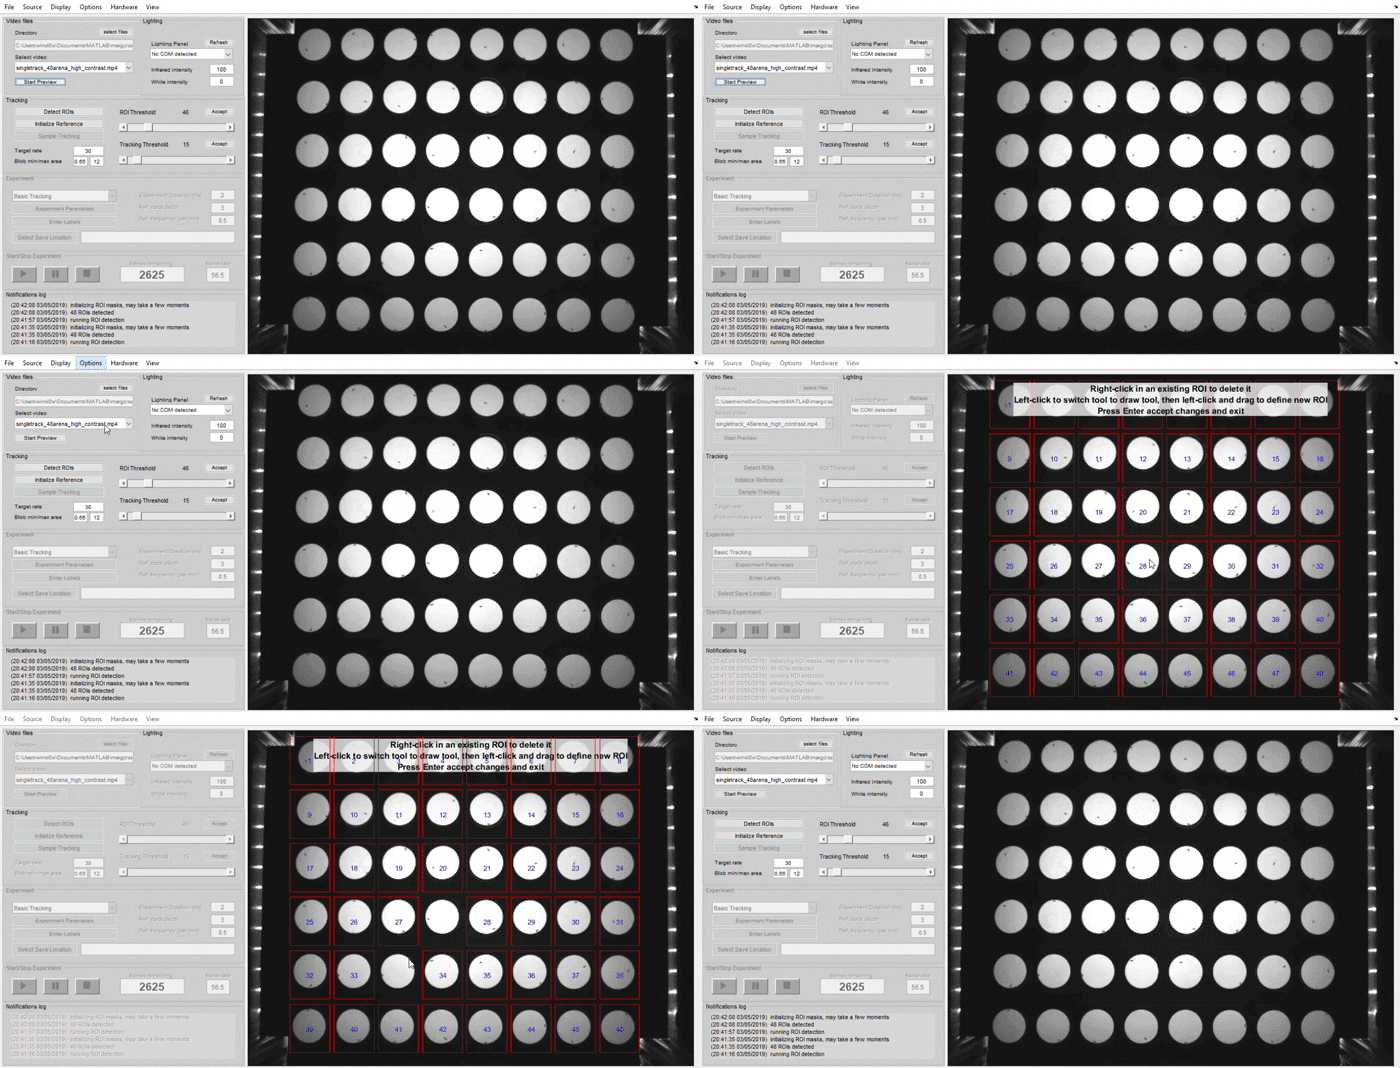
Through the manual ROI editing option, we can add and remove ROIs. Inspection of the sample video shows that the flies in ROIs #28 and #35 never move over the duration of the video (these will be numbered once we access the ROI editor). To remove these ROIs from the tracking:
1. Open the menual ROI editing utility by selecting Options > edit ROIs

2. Right click on the target ROIs to remove them. Press the Enter key when finished to close ROI editing.
MARGO isolates moving objects by removing the static background. The goal of this section is two-fold: 1) initialize an image of the background, which should ideally look something like the arenas with no flies and 2) ensure that the tracking threshold and the minimum/maximum blob area work are adjusted for good tracking. See background referencing and tracking parameters for additional details. To initialize a background reference:
1. Initialize background referencing by clicking Initialize Reference

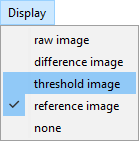
2. By default, the image preview will show the current background reference image as it develops. Switch the display mode to threshold to view the thresholded background subtraction image. Keep in mind that we can refer back to the display menu to switch between views at any time.
3. By default, the tracking threshold will attempt to automatically adjust to an initial value (in this case 32 on a scale 0-255) Adjust the Tracking Threshold slider until a small amount background pixel noise remains. The goal here is to allow the fly blobs to be as large as possible by reducing the threshold, without reducing it so much that background noise interferes with tracking. Set the threshold value to 3 for an example of bad thresholding (the tracking should break down at this point). Gradually increase the threshold to 18 to watch the foreground separation improve.
4. (optional) Minimum and maximum blob area define the bounds for how small/large tracked objects can be. The default minimum maximum blob area (5 and 150) work well for this sample. Looking closely, we can see that a small amount of blobs from background pixel noise remain with the threshold set to 18. This noise is ignored by the tracking because the noise blobs are below the minimum allowed blob area. Try temporarily adjusting the minimum blob size to 1 for an example of the bounds being set too permissively (tracking should start to pick up background noise). Reset the minimum area to 5 and adjust the maximum to 20 for an example of the bounds being set too exclusively (tracking should should stop following flies). Reset the bounds to 5 and 150 to re-establish tracking.

5. (optional) Select View > trace ID numbers to visualize object identity assignment in real time and use the Display menu to view to inspect the background reference image as it develops.

5. Accept the background reference image by clicking Accept next to the tracking threshold slider
MARGO collects a sample of the number of above threshold pixels during "clean" tracking prior to recording to serve as a basis for comparison later. If the distribution of above threshold pixels substantially deviates from this sample during recording, the background reference is automatically reacquired to ensure the quality of tracking. The goal of this section is acquire this sample and visually inspect the tracking to ensure that it is representative of clean tracking. See noise profiling for additional details on disabling or adjusting noise sampling. To sample the tracking:
1. Initialize the above threshold pixel distribution sampling by clicking Sample Tracking
2. The display mode will automatically switch to show the thresholded tracking image. Watch the tracking to ensure that it is representative of good tracking (i.e. object blobs are clearly visible and background noise is not tracked). If necessary, repeat the background inititialization or adjust the tracking parameters until satisfied with the tracking. By default the thresholded background subtraction image is sampled across 100 frames. Once the sampling is complete, the Experiment control panel will be enabled.
By default MARGO will measure distances in pixels. By measuring the pixel length of an object with a known length in mm, we can create a mm per pixel unit conversion factor.
1. Open the distance scale utility under the Options menu

2. In the distance scale dialog, set the target size parameter to the diameter of one of the arenas (28mm) and click Draw new line to initialize the measurement.

3. Click and drag in the preview window along the diameter of an arena to place a new line. Adjust the line end points if necessary.

4. Close the distance scale utility to accept the measurement. Setting the unit conversion will automatically convert distance parameters from pixels to mm and area parameters from pixels2 to mm2 (e.g. blob min/max area should change from 5/150 pixels2 to ~0.65/12mm2).
The goal of this section is to set some meta data for the experiment and assign labels to each ROI. The Experiment UI panel also includes options to adjust the duration of the experiment and background referencing parameters, but the default parameter values should work fine for this tutorial. See experiment settings for additional details.
1. Set labels for the ROIs information by clicking Enter Labels

2. Label the sex of the flies in the first half of the ROIs as female by changing "ROI End" to 24. Clicking onto the second row will autopopulate labels for the remaining ROIs. Then label remaining ROIs as male. Click Accept Label to confirm the labels and exit.

3. Set the save directory by clicking Select Save Location.

At any point, we can save the GUI configuration to file be loaded in at a later time. Saving configurations is particularly useful when conducting multiple experiments of a similar type. Configuration presets save:
- Parameter settings
- Hardware settings
- Experiment meta data
Due to need for precise measurements of the following items in every experiment, presets do not save:
- ROI positions
- Background reference images
- Noise sampling
To save a new preset:
1. Select File > save new preset.
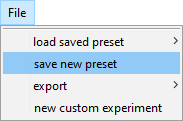
2. Save the new preset to the default MARGO profiles for easy access later.
./margo/profiles/setup_tutorial.mat
MARGO is ready to begin tracking with the basic setup configured. Any of the above steps can be repeated and additional parameters can be configured to optimize MARGO to your experiment. To initiate tracking:
1. Click the play button to initiate tracking.

2. (optional) Tracking can be canceled at any time, either to end tracking prior to the end of the video/experiment duration or to return to the experiment configuration. For the purposes of this tutorial, let's assume that we made a mistake in labeling the flies and want to go back and fix the mistake (some GUI utilities, including the labeling utility, are disabled during tracking). Click the stop button to stop tracking.

3. (optional) Select Delete when prompted to save or delete the data. Opting to delete the data will delete the raw data collected up to that point and restore the GUI to its state just prior to tracking. With the Enter Labels option re-enabled, we can correct the mistake and restart tracking.Opting to Save the data would save all the raw data up to that point and conclude tracking, at which point the GUI would re-initialize to its default state for the next tracking session.

4. Wait for tracking to complete (restart tracking with the play button if you completed steps 2-3). Preview window display mode and tracking parameters can be adjusted in during tracking. Tracking can be terminated early by selecting the stop button, at which point the tracking data can be saved or deleted.
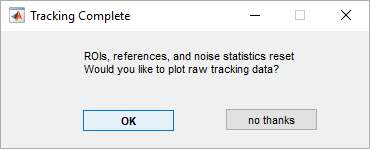
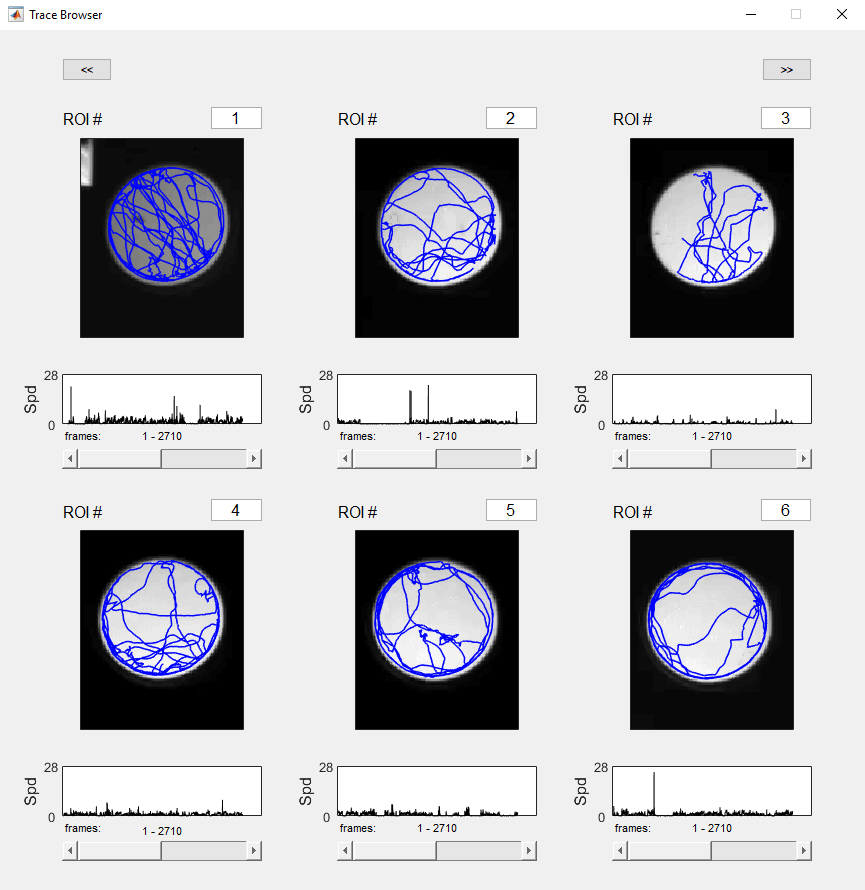
5. (optional) Once tracking is complete, MARGO will prompt us to preview the raw centroid traces. Select OK to launch the trace browser window.
6. (optional) Preview raw trace data in the trace browser. Cycle through ROIs using the << and >> buttons or manually enter an ROI number in the box at the top of each plot. The raw speed traces for the corresponding ROIs are displayed below each plot. Cycle through frames using the slider bar under each speed trace plot.
The topics covered in this tutorial are not an exhaustive list of the features and customization offered in MARGO. Learn more about getting the most out of MARGO:
- Test MARGO's multitracking mode on the sample video:
./margo/examples/sample_videos/larvae_multitrack.mp4 - Data Analysis Tutorial
- Custom Experiment Tutorial
- Options and Parameters