This section gives an introduction to the CNApy UI and its components and functions.
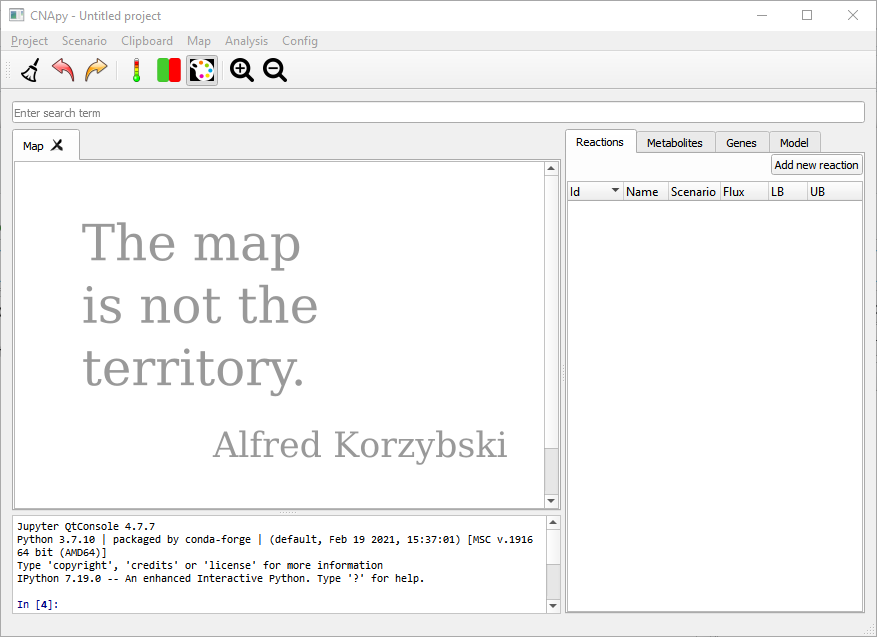
This is an empty project on the right hand side we see the empty lists of reactions, metabolites and genes. On the left we see the embedded Jupyter Console where one can interact programmatically with the model and UI. We can create a new project by importing SBML models, editing the reactions and adding graphical maps. We can also load one of the projects included in our projects repository.
Let’s go to Project in our menubar and open the ECC2comp.cna project.
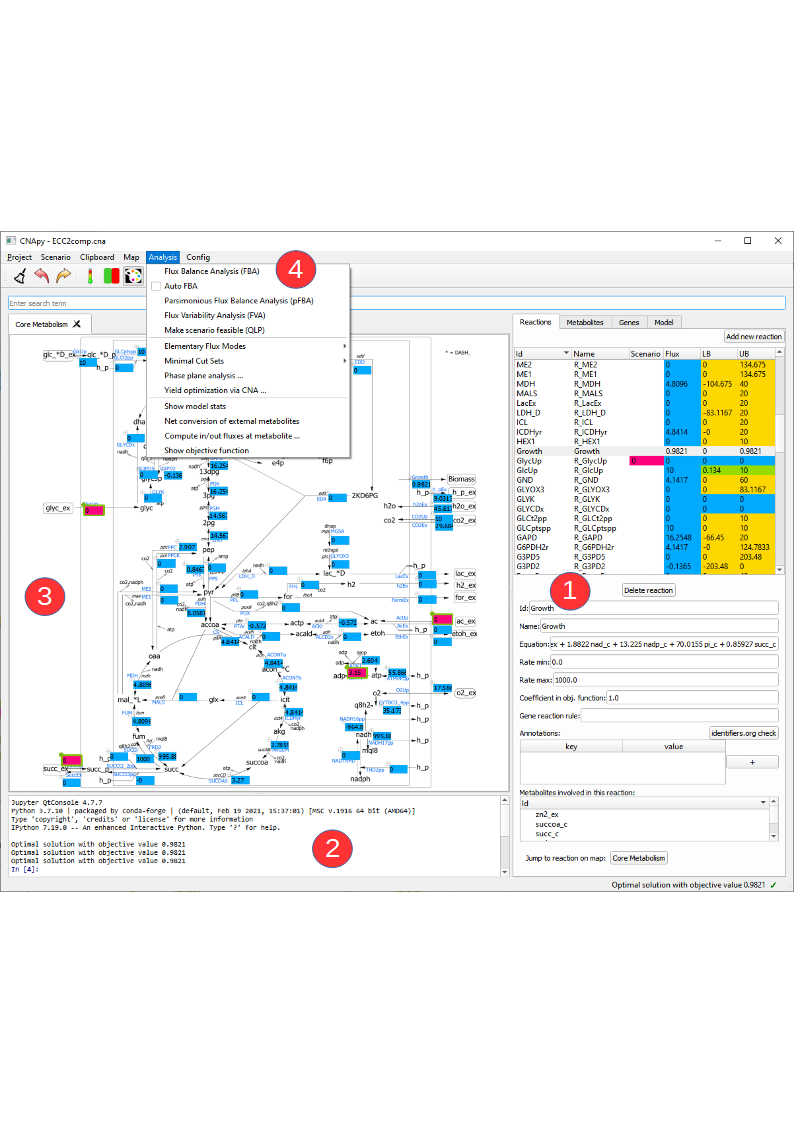
In this picture we see CNApy with the open ECC2comp project. On the right hand side (1) we see the populated reactions and metabolites lists with the color coded current values and a form with corresponding details for the selected reaction/metabolite.
The upper part of the reactions lists contains several columns. In the "Scenario" column the current scenario values are shown and can also be edited via this column. The "Flux" column contains the results of the last computation, e.g. the fluxes from a FBA. The "LB" and "UB" columns show the lower/upper bounds of the reactions and after a FVA the results of this analysis will be displayed there.
The reactions list contains buttons that lets us add/delete reactions to/from the model. Changing the metabolite identifier or other details in the metabolite/reaction form has an instant effect on the corresponding reactions/metabolites in the model.
When selecting a metabolite in the metabolite tabs a list of reactions (and corresponding equations) in which this metabolite participates is shown a the bottom. By double-clicking on a reaction or metabolite ID one can switch to the respective object.
The console (2) now shows the output of some computations, and above the console we have a map view (3) with a graphical representation of our network. On top (4) we have the menu bar which gives us access to the various functionalities of CNApy and a Toolbar for quick access to often used functions. Underneath, you can also see the search bar with which you can search for the IDs of reactions, metabolites or genes, depending on which tab you have opened. The search results are shown in the respective list (1). In addition to only searching for IDs, you can also look for annotations (given in the annotations table of a single reaction, metabolite or gene) if you activate the respective checkbox.
We can add new maps via the Map menu, and drag reactions from the reaction list onto the desired position on the map.

