fwd-edu-breakout=github:climate-action-kits/pxt-fwd-edu/fwd-breakout
sonar=github:climate-action-kits/pxt-fwd-edu
datalogger=datalogger
fwdSensors.touch.fwdOnTouch(jacdac.ButtonEvent.Down, function () {
    Logging = true
    music.play(music.tonePlayable(262, music.beat(BeatFraction.Double)), music.PlaybackMode.UntilDone)
})
datalogger.onLogFull(function () {
    Logging = false
    music.play(music.tonePlayable(523, music.beat(BeatFraction.Double)), music.PlaybackMode.UntilDone)
})
input.onButtonPressed(Button.AB, function () {
    datalogger.deleteLog()
    music.play(music.tonePlayable(131, music.beat(BeatFraction.Double)), music.PlaybackMode.UntilDone)
})
let WaterLevel = 0
let Logging = false
datalogger.setColumnTitles("Water Level")
Logging = false
loops.everyInterval(1000, function () {
})
basic.forever(function () {
    WaterLevel = fwdSensors.sonar1.fwdDistance()
    basic.pause(1000)
    led.plotBarGraph(
    WaterLevel,
    0.3
    )
})
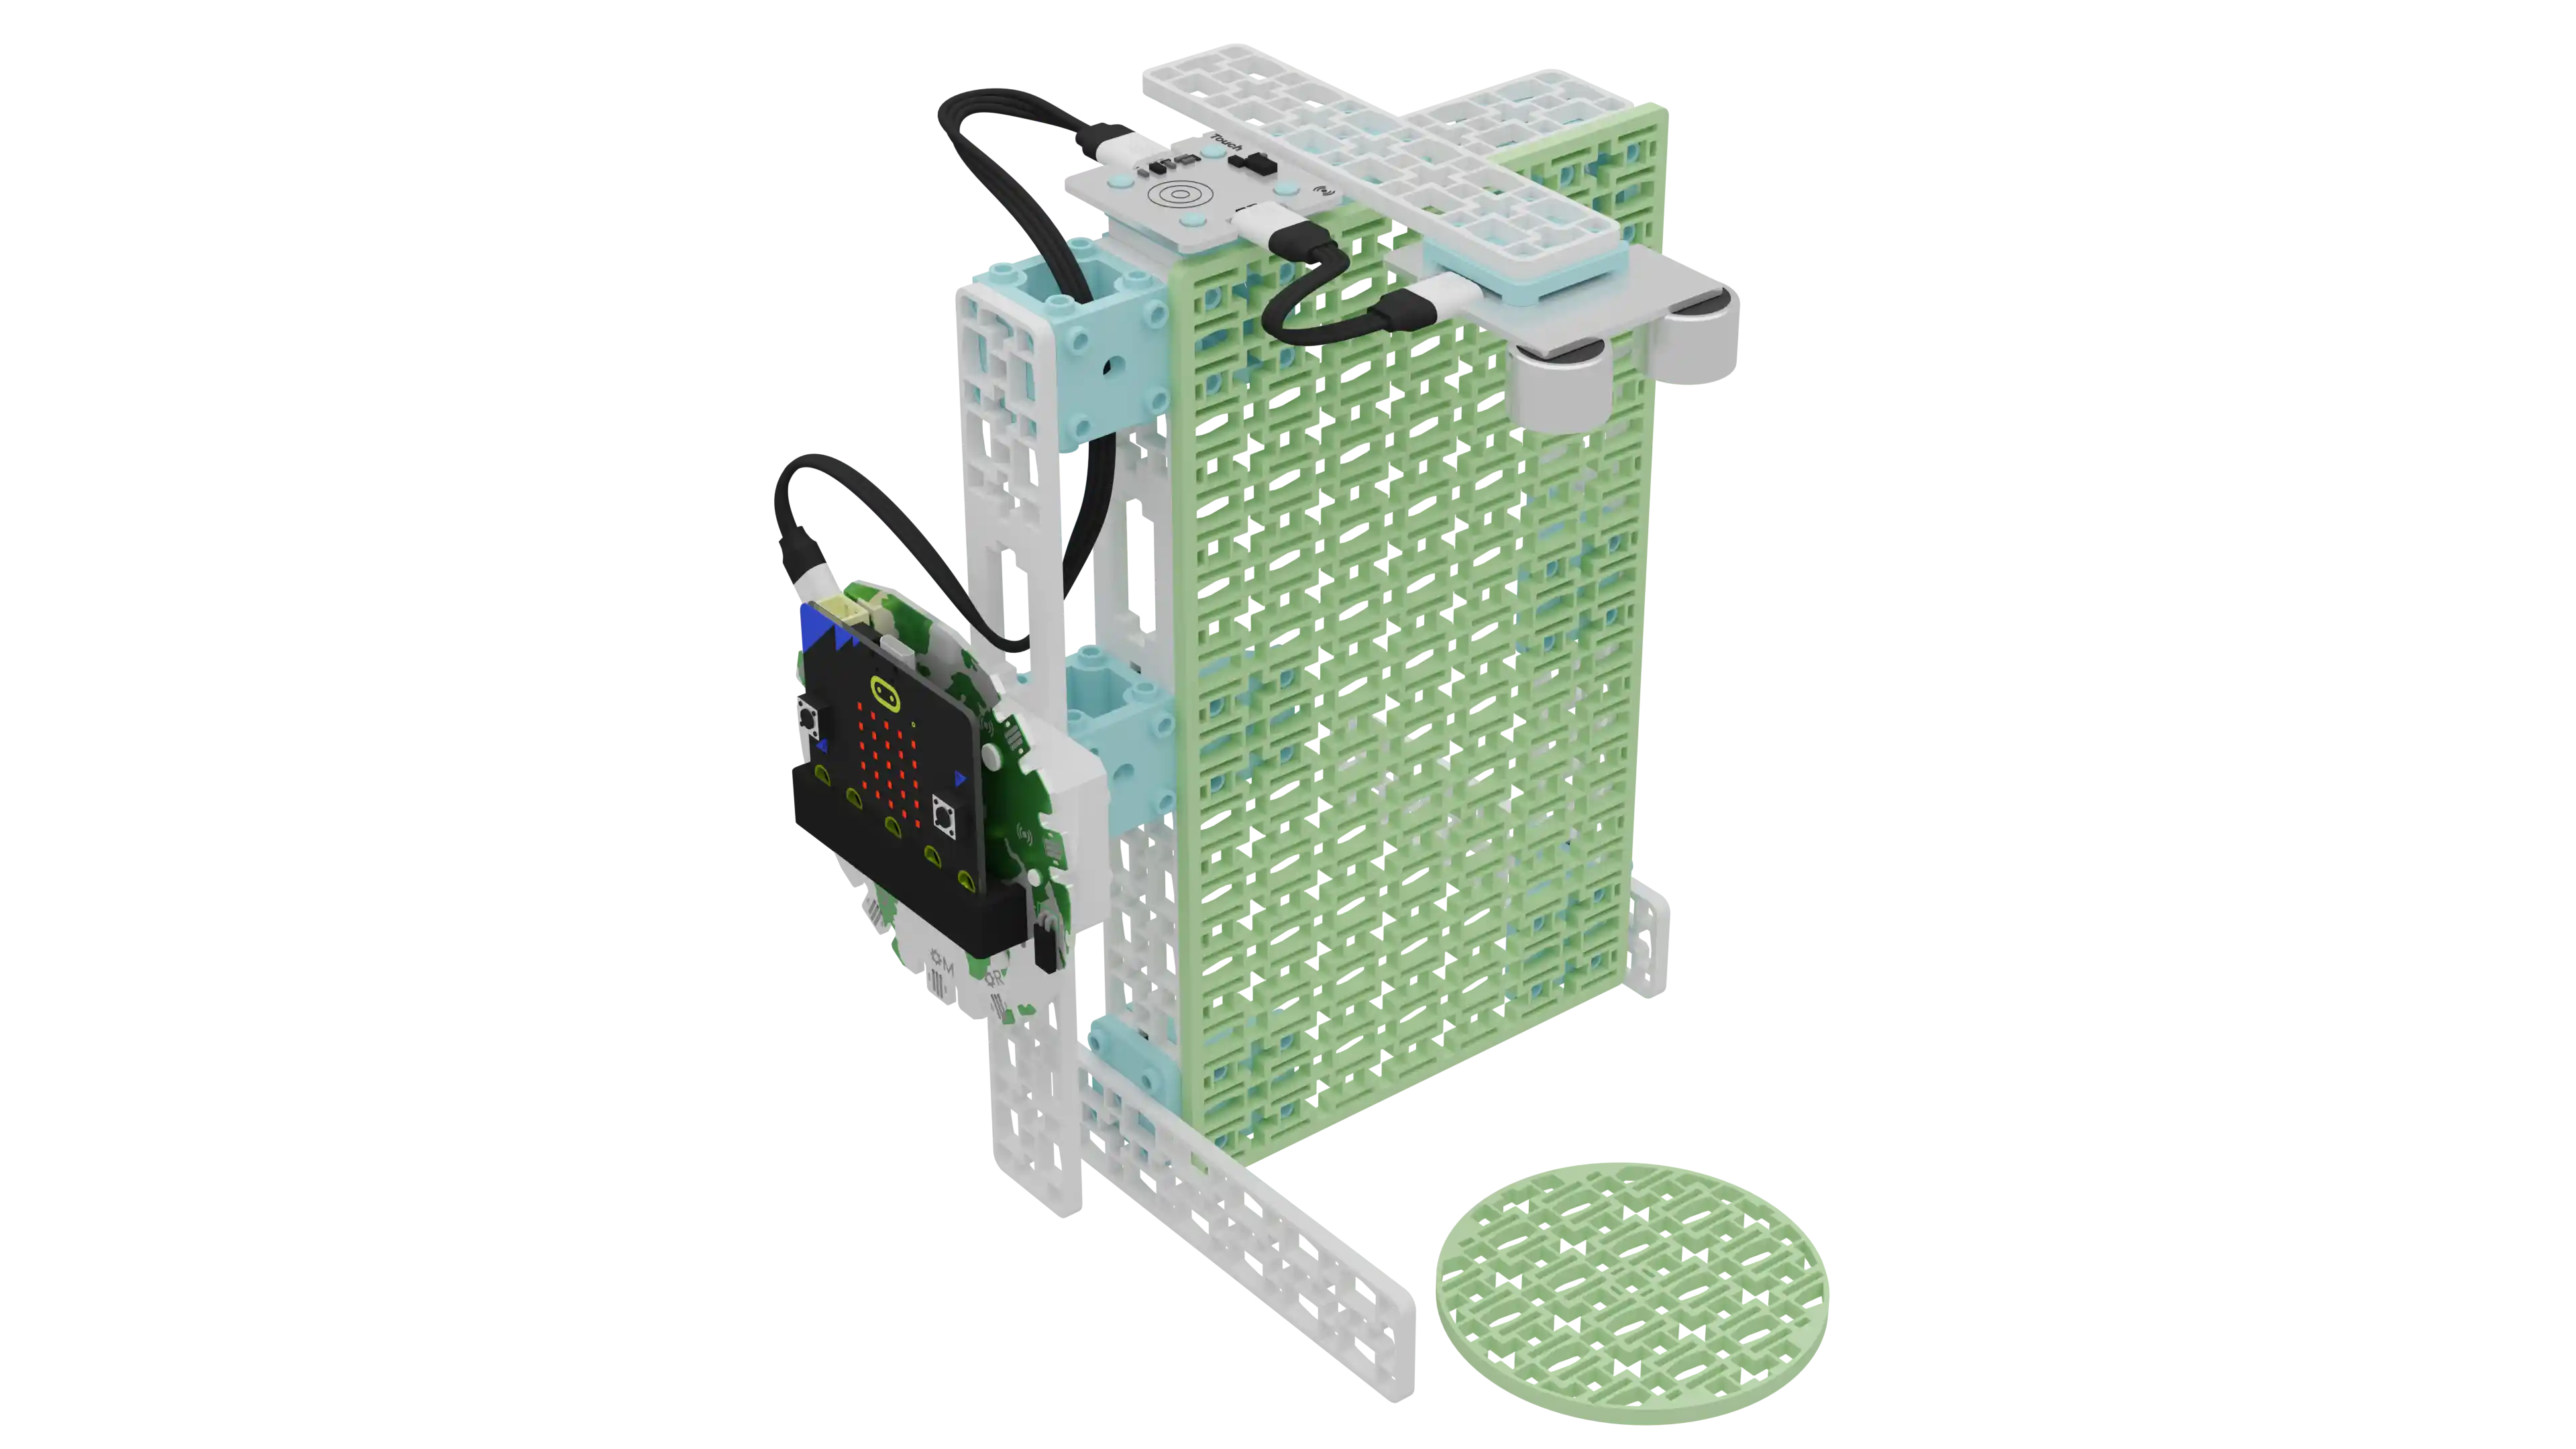
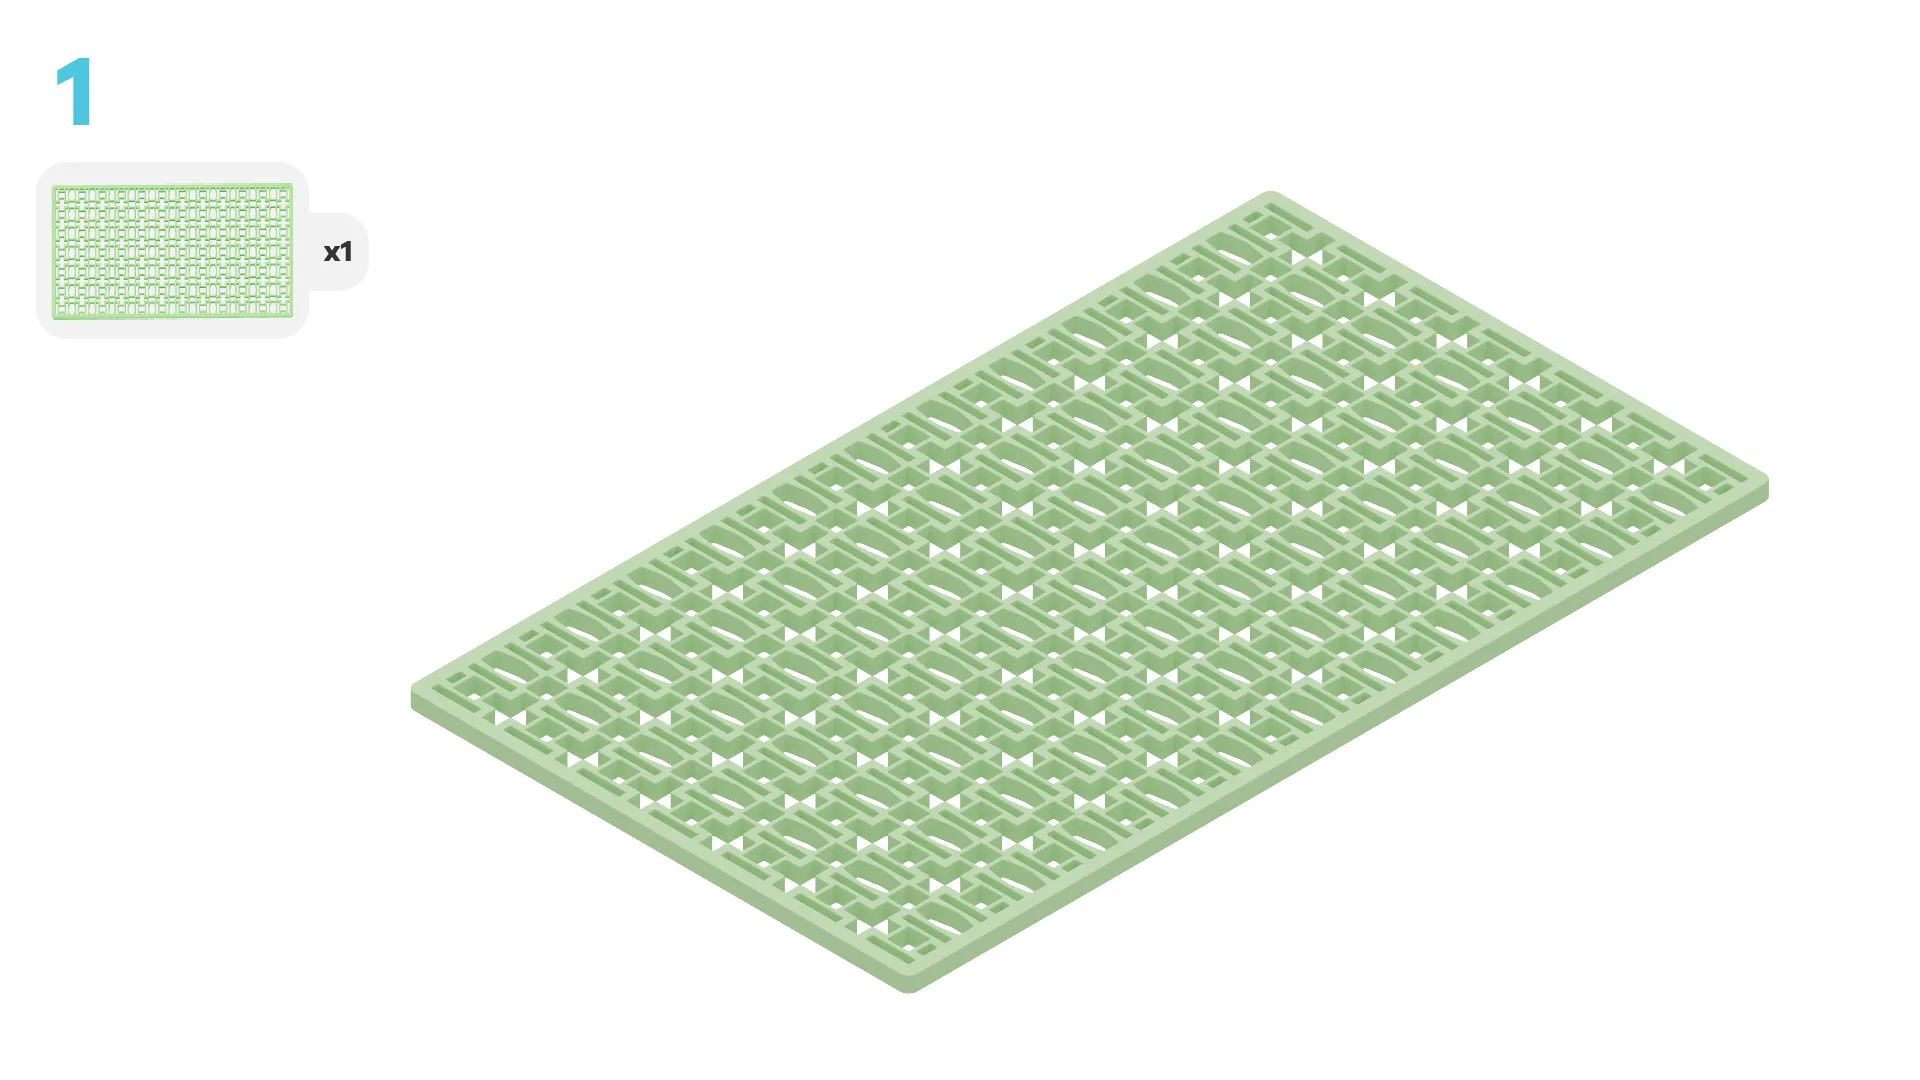
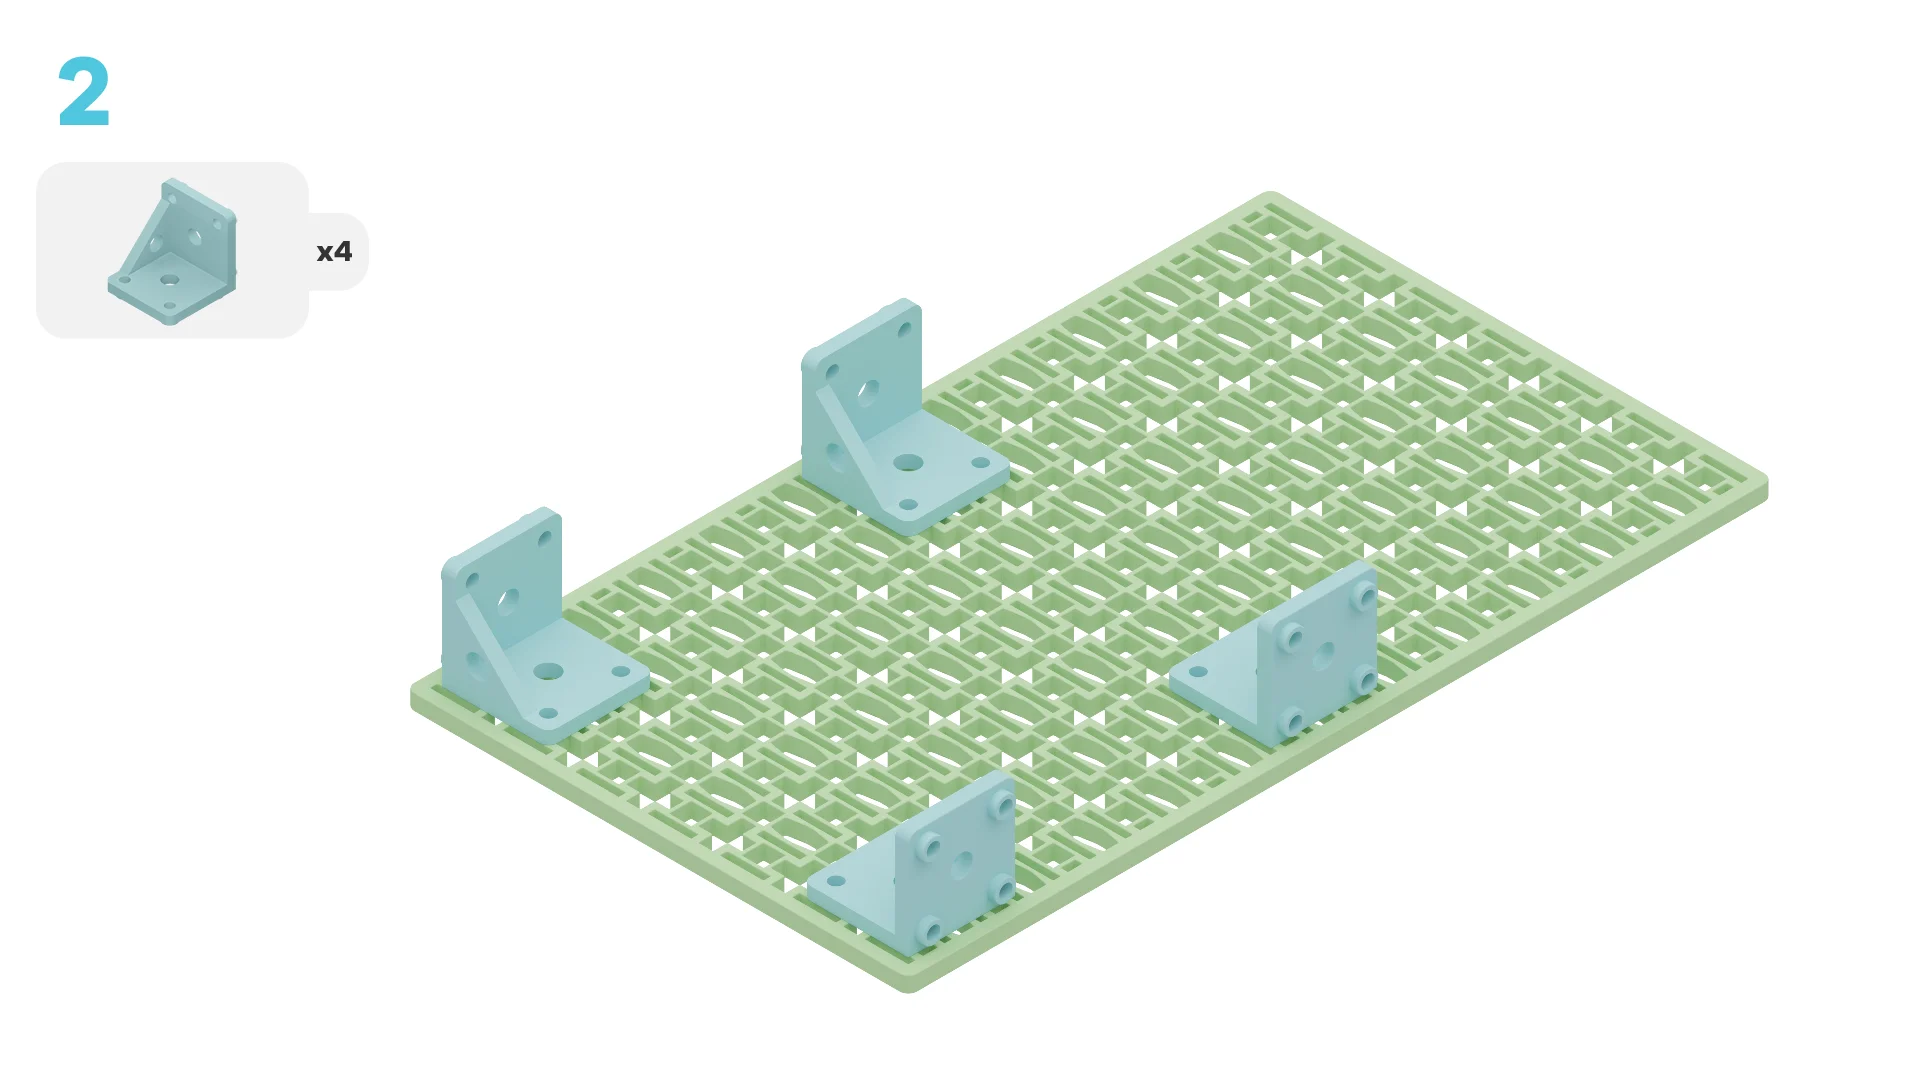
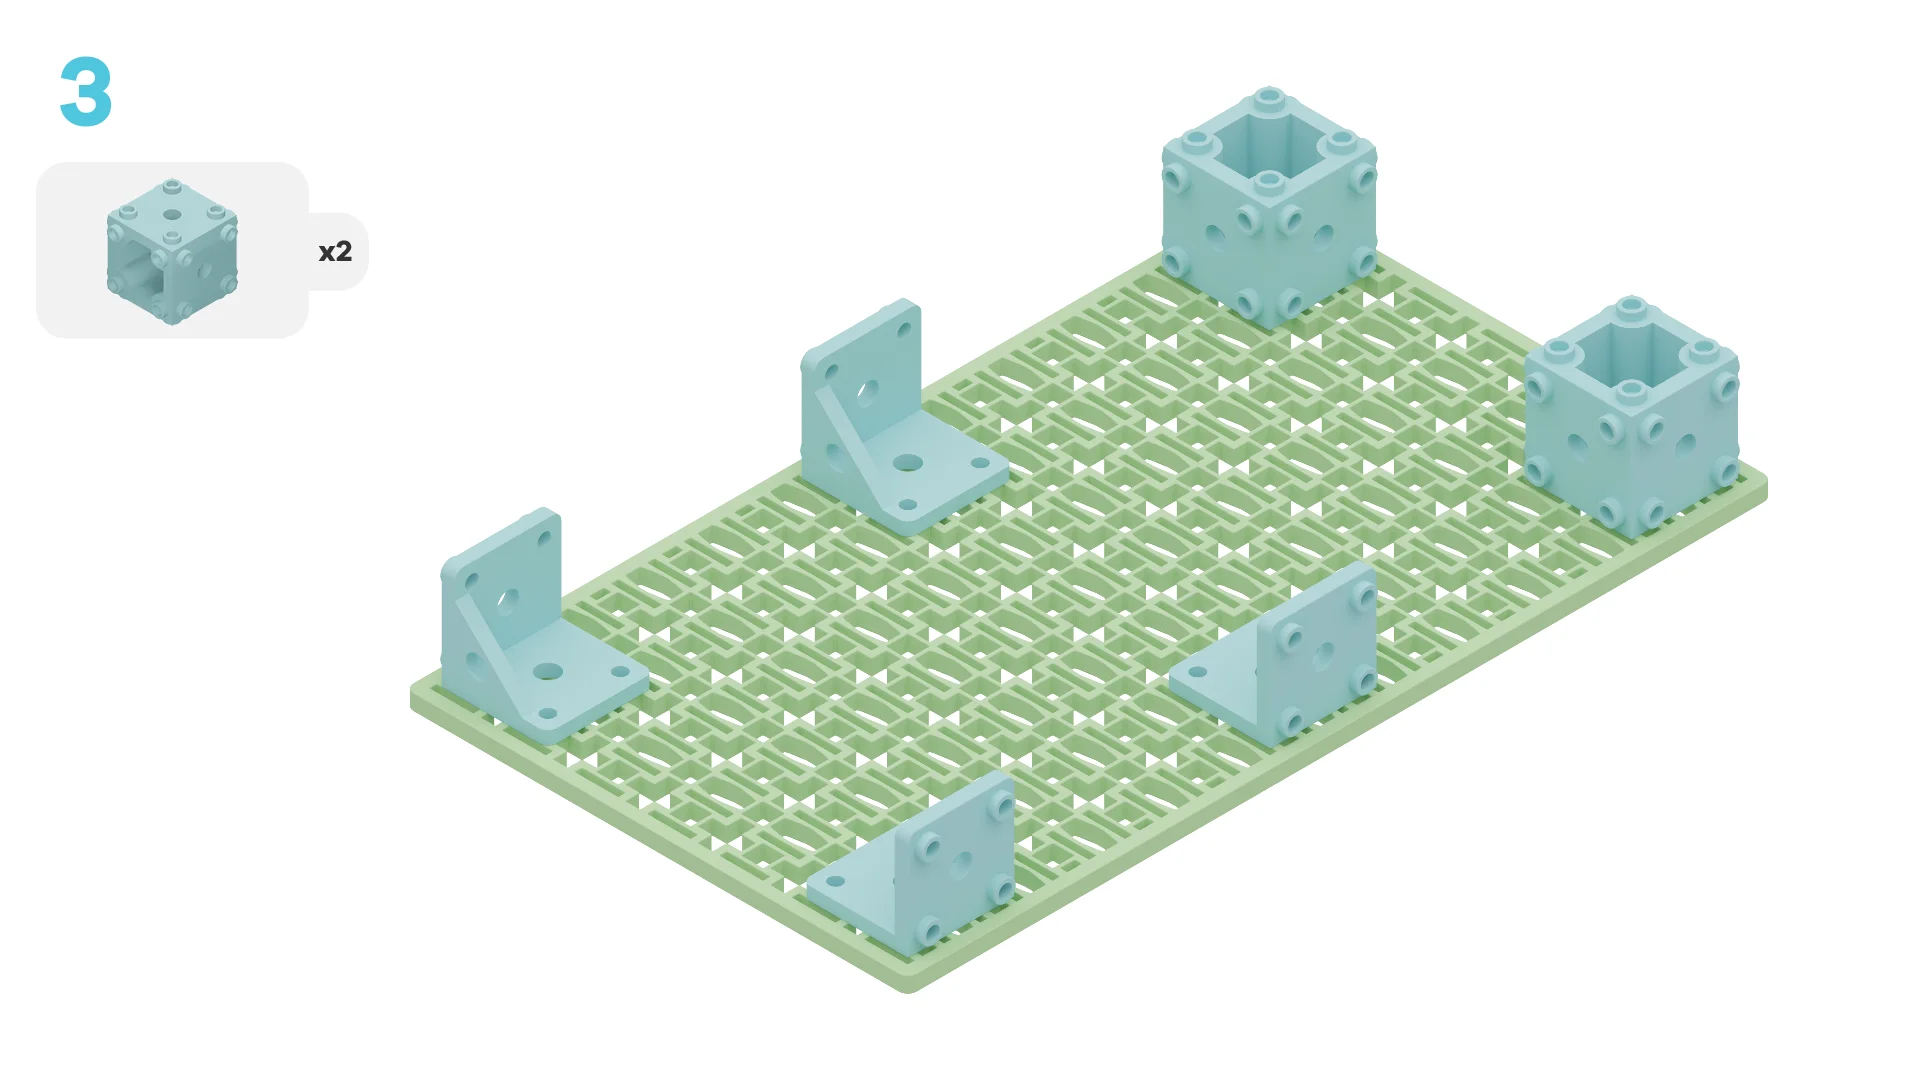
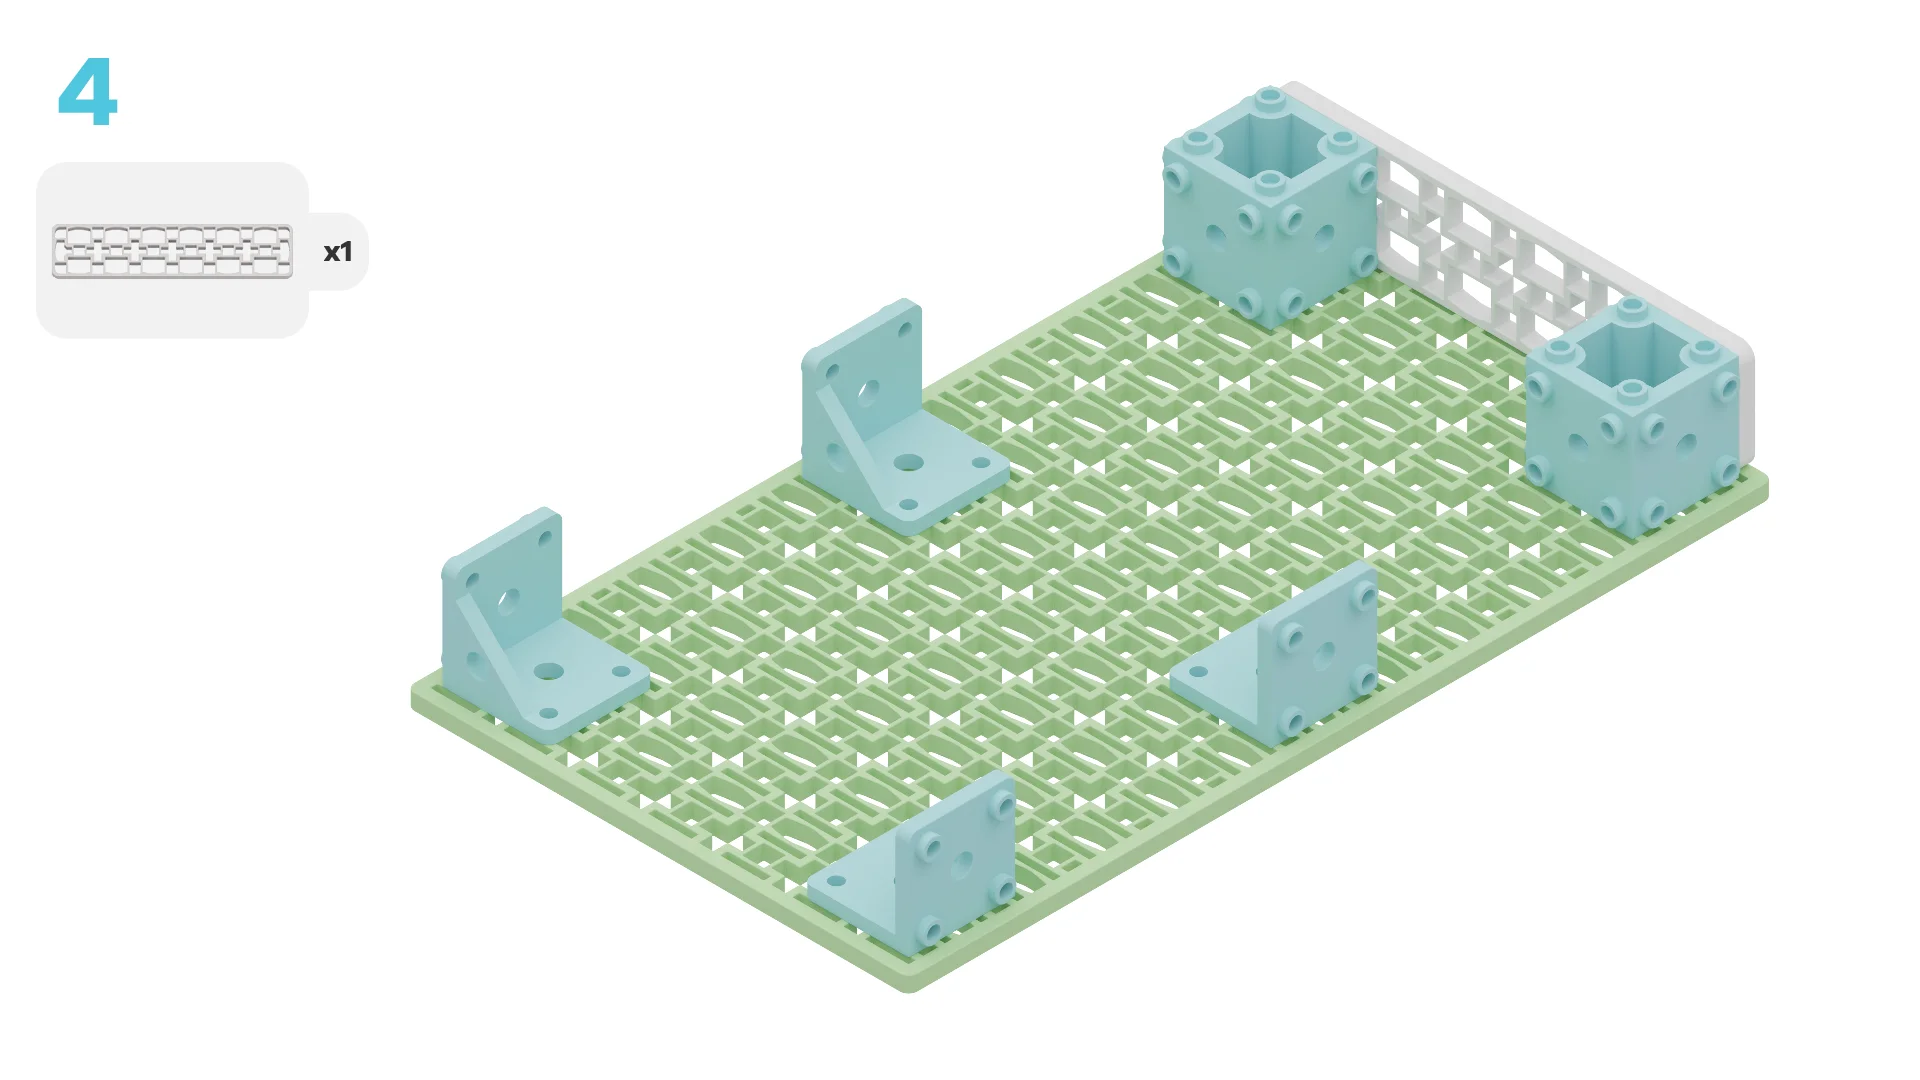
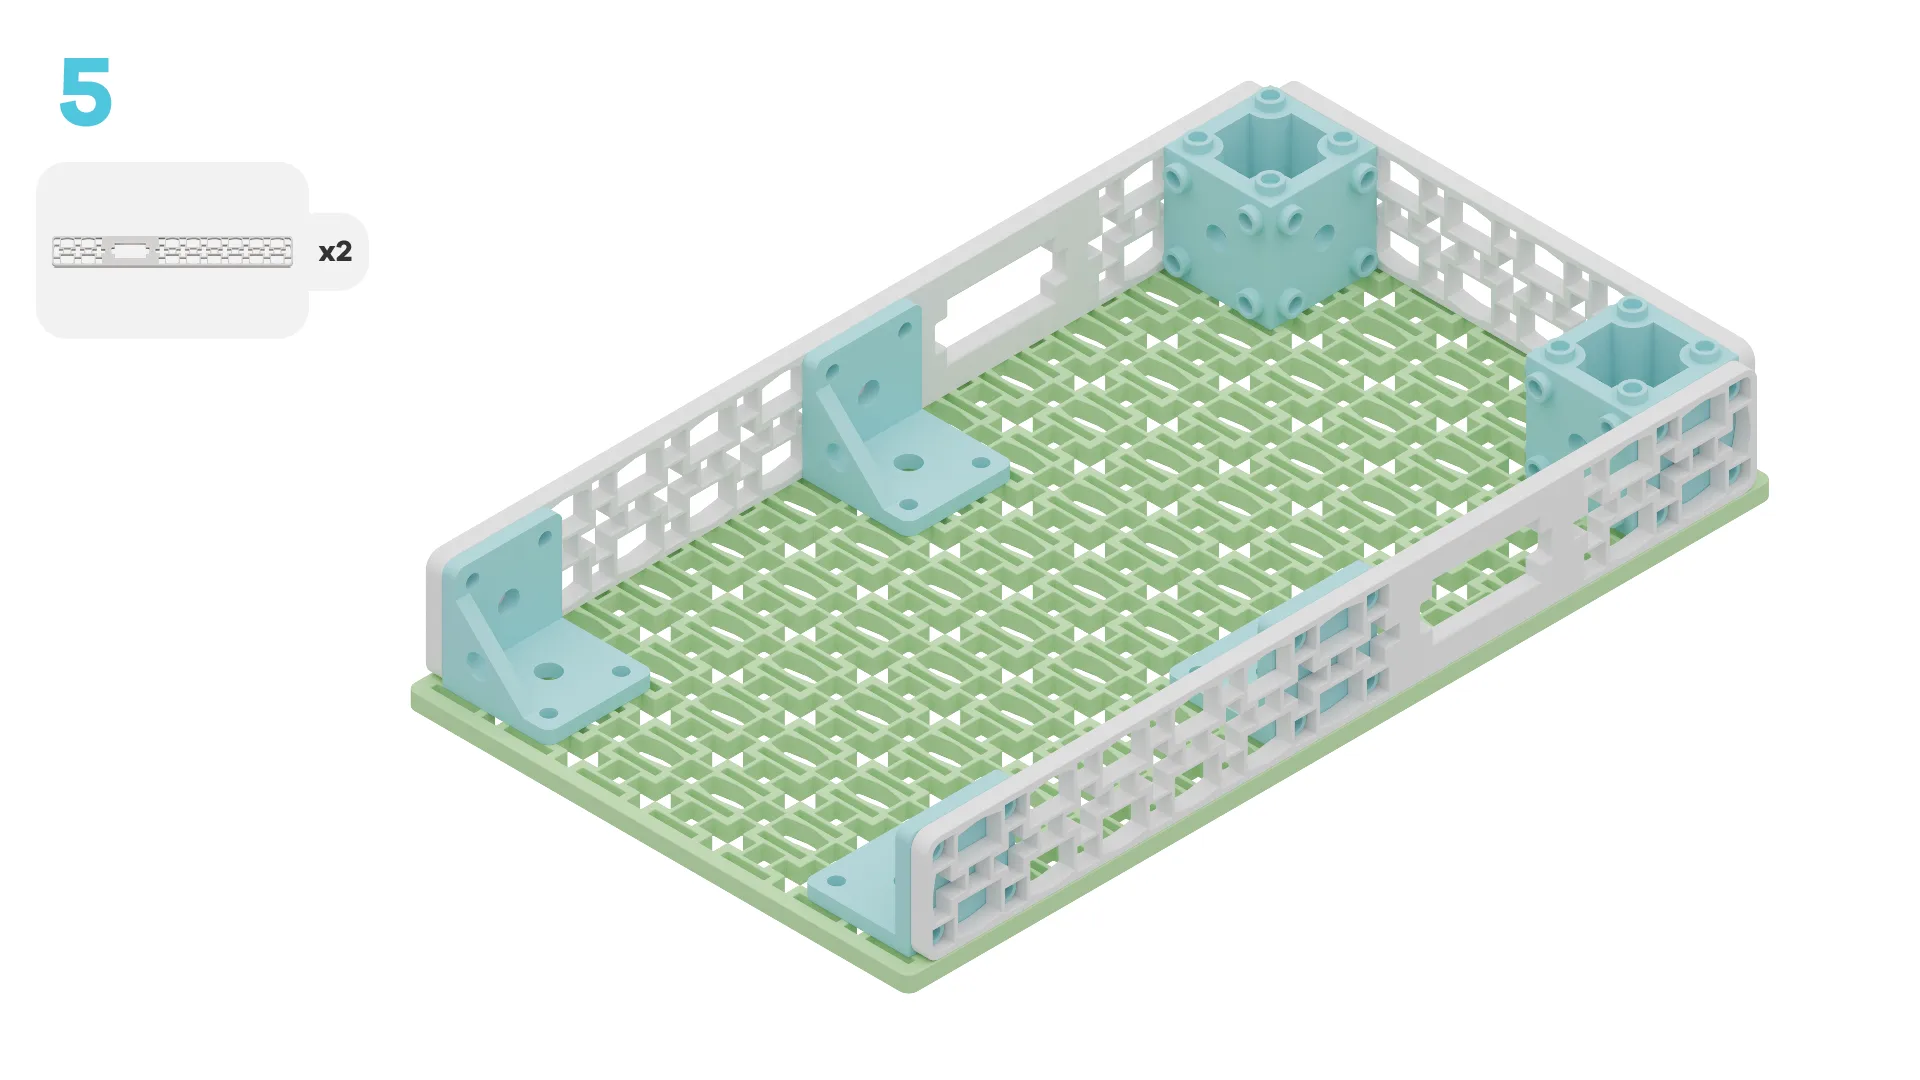
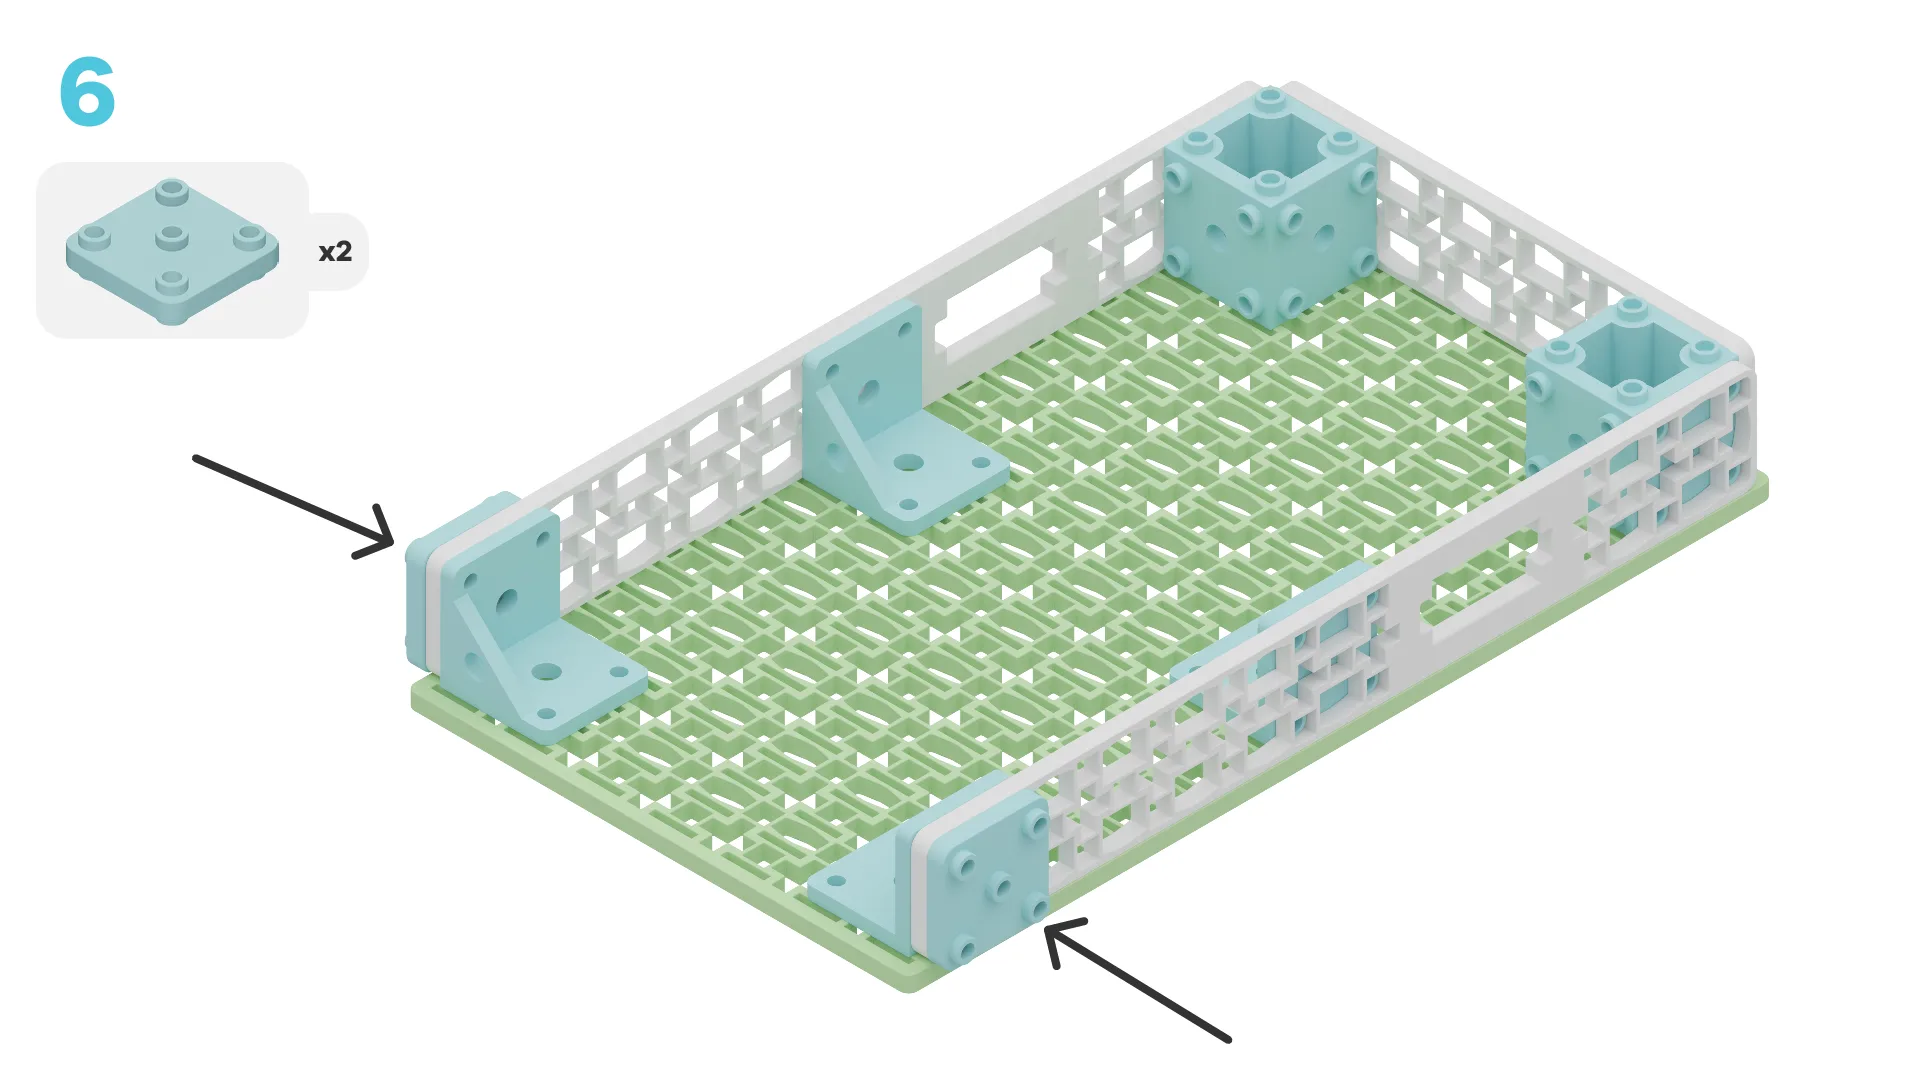
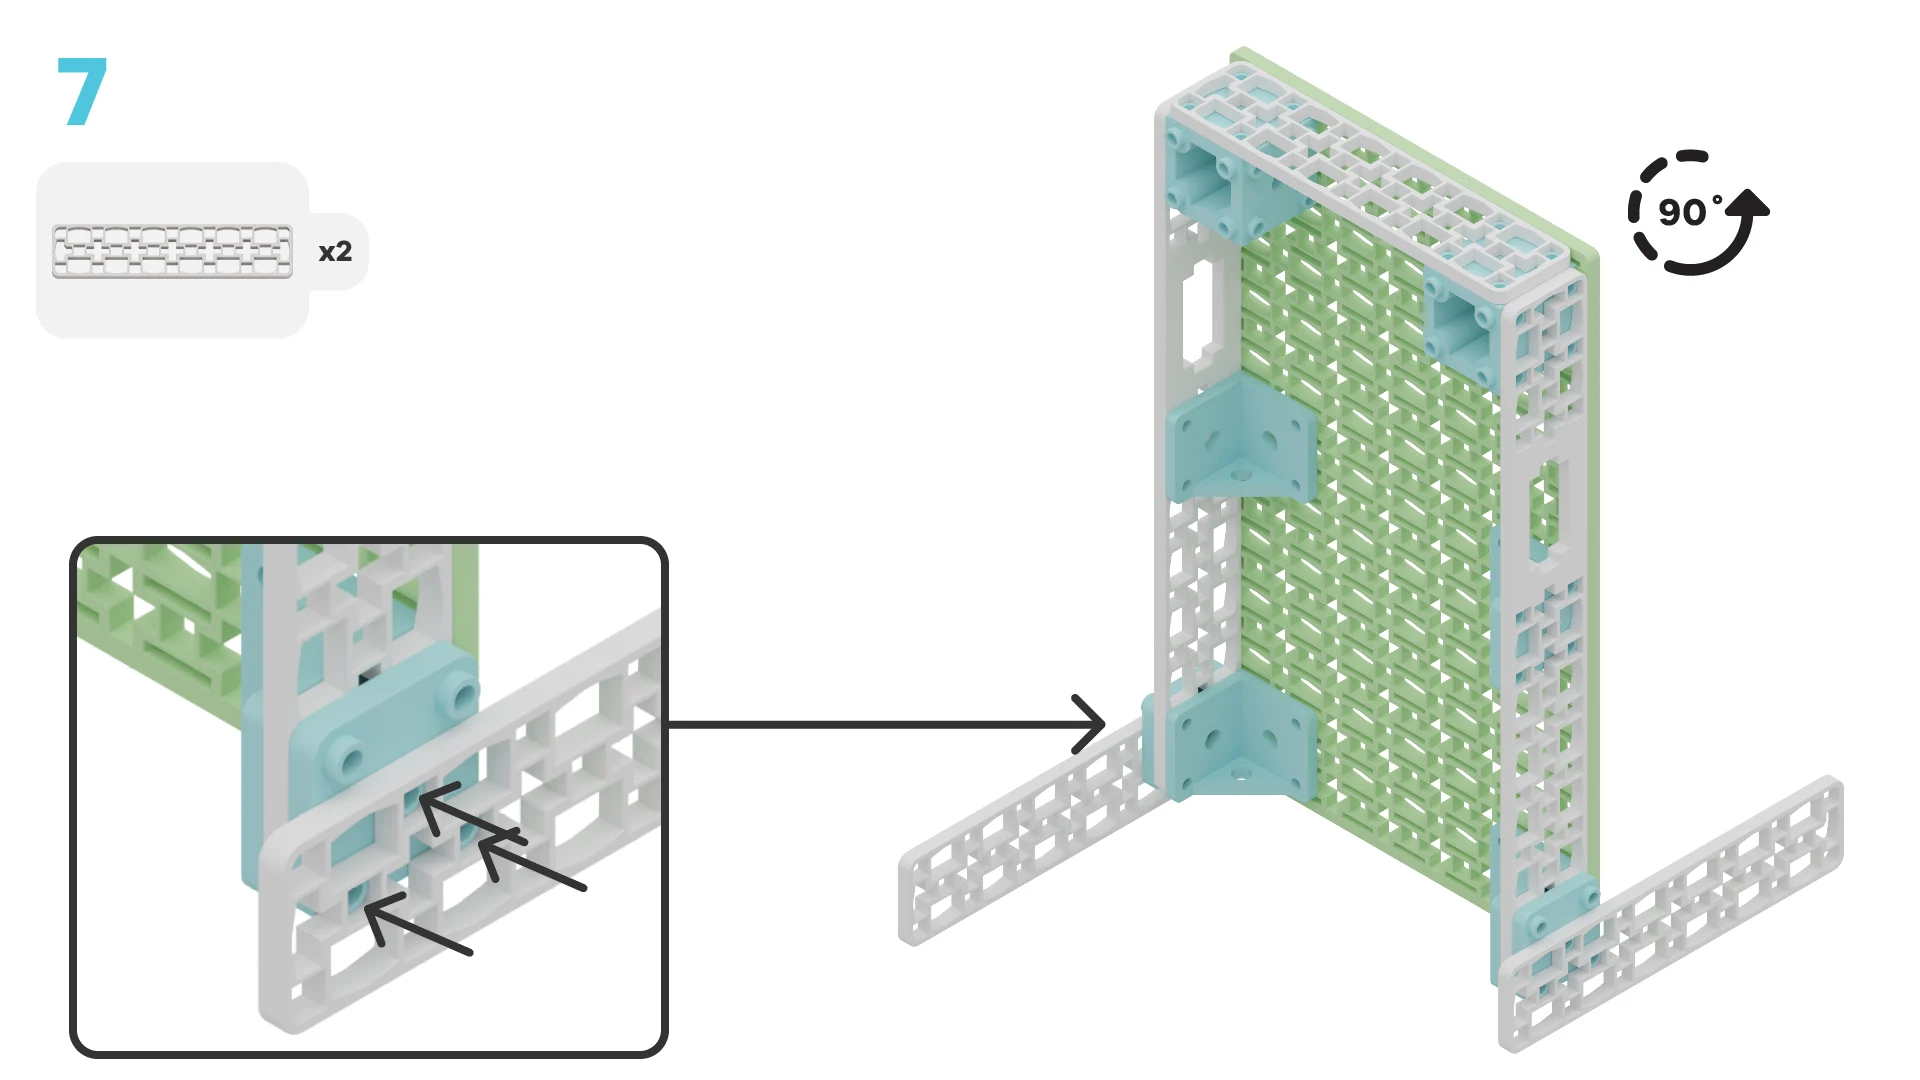
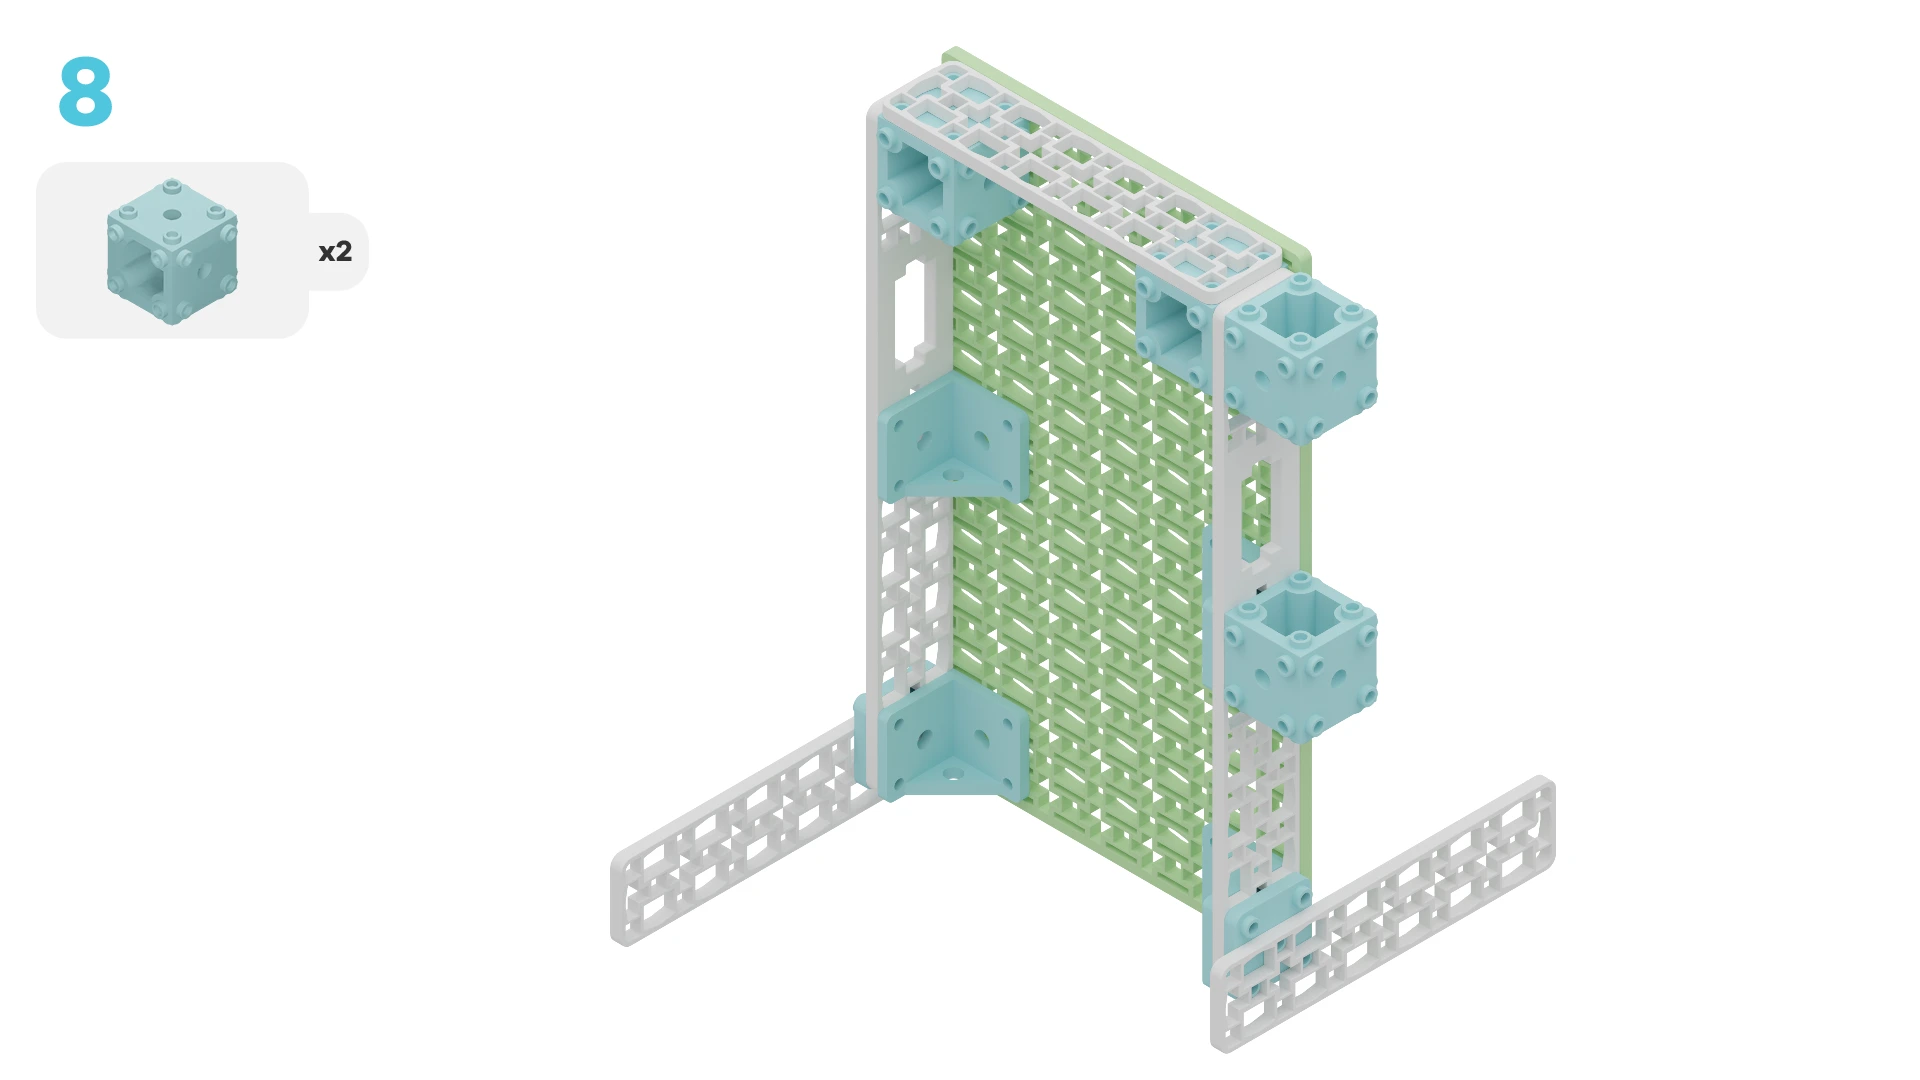
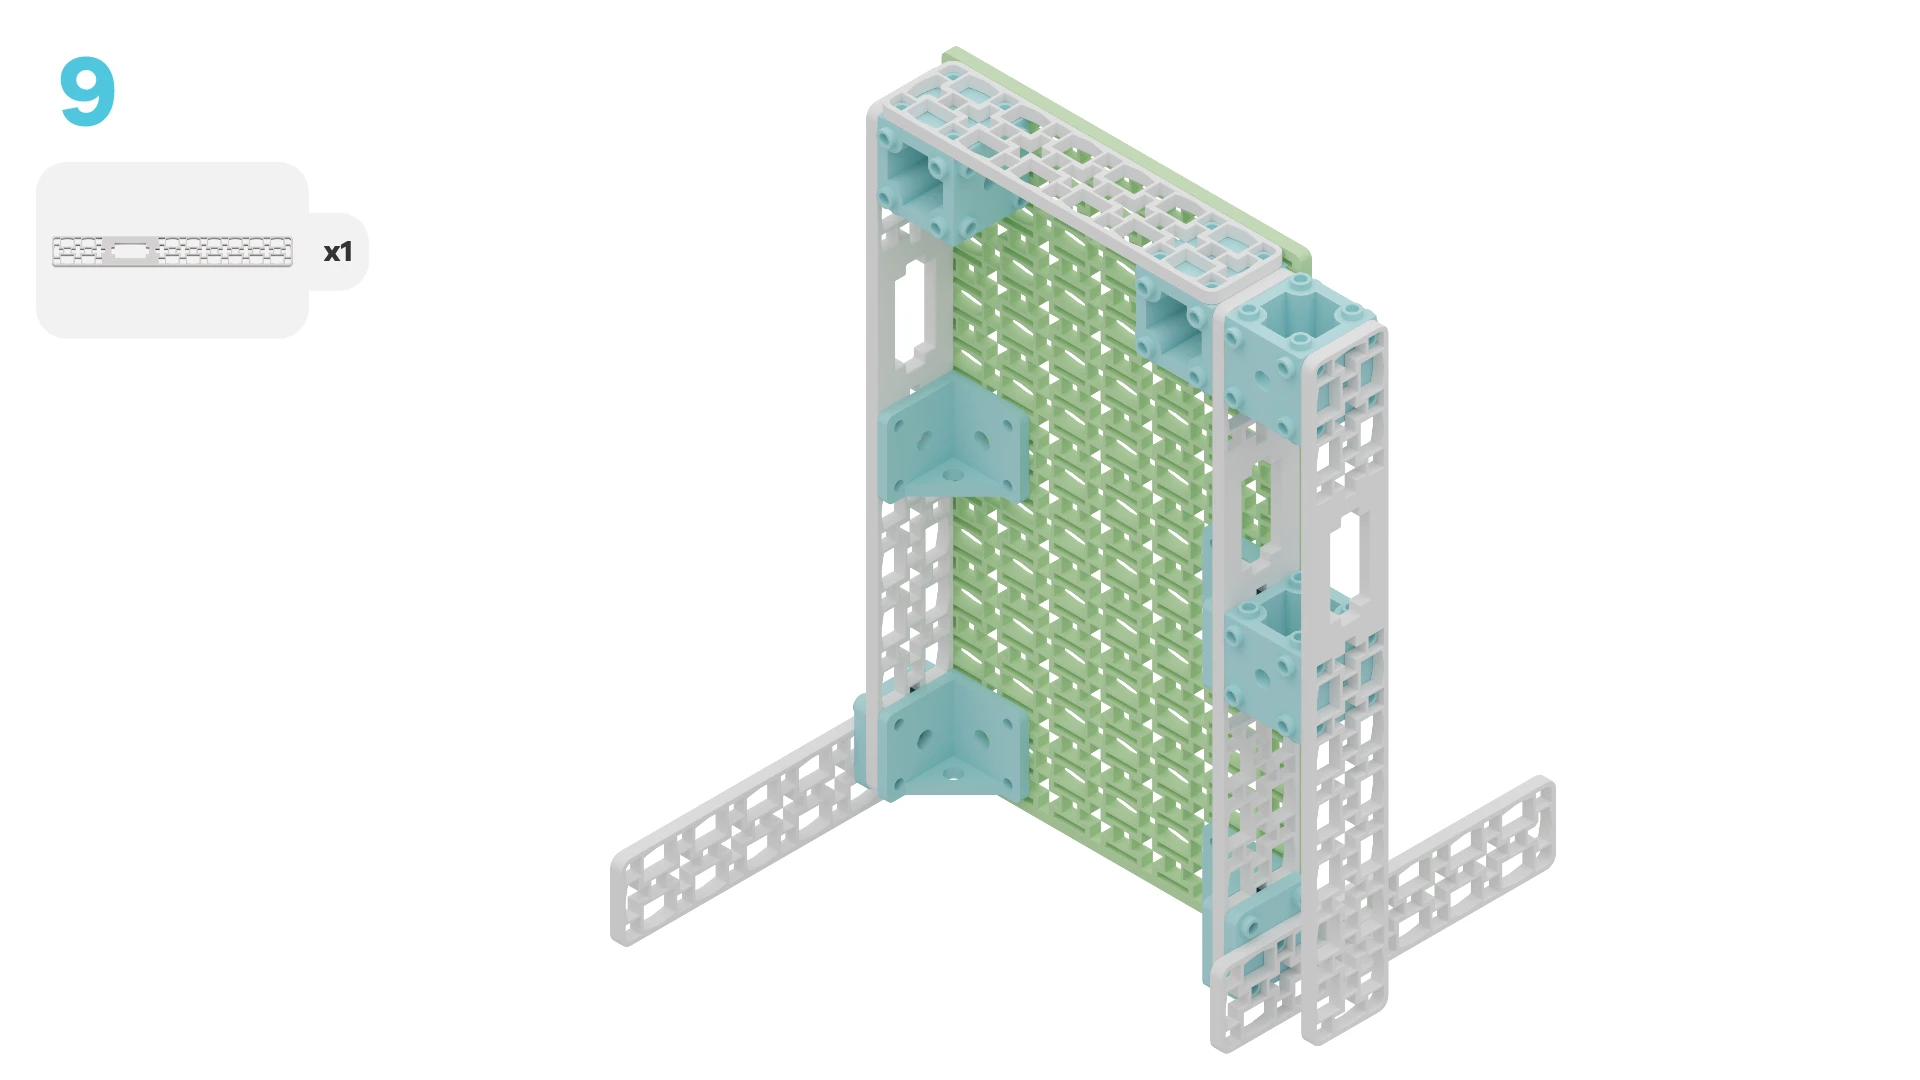
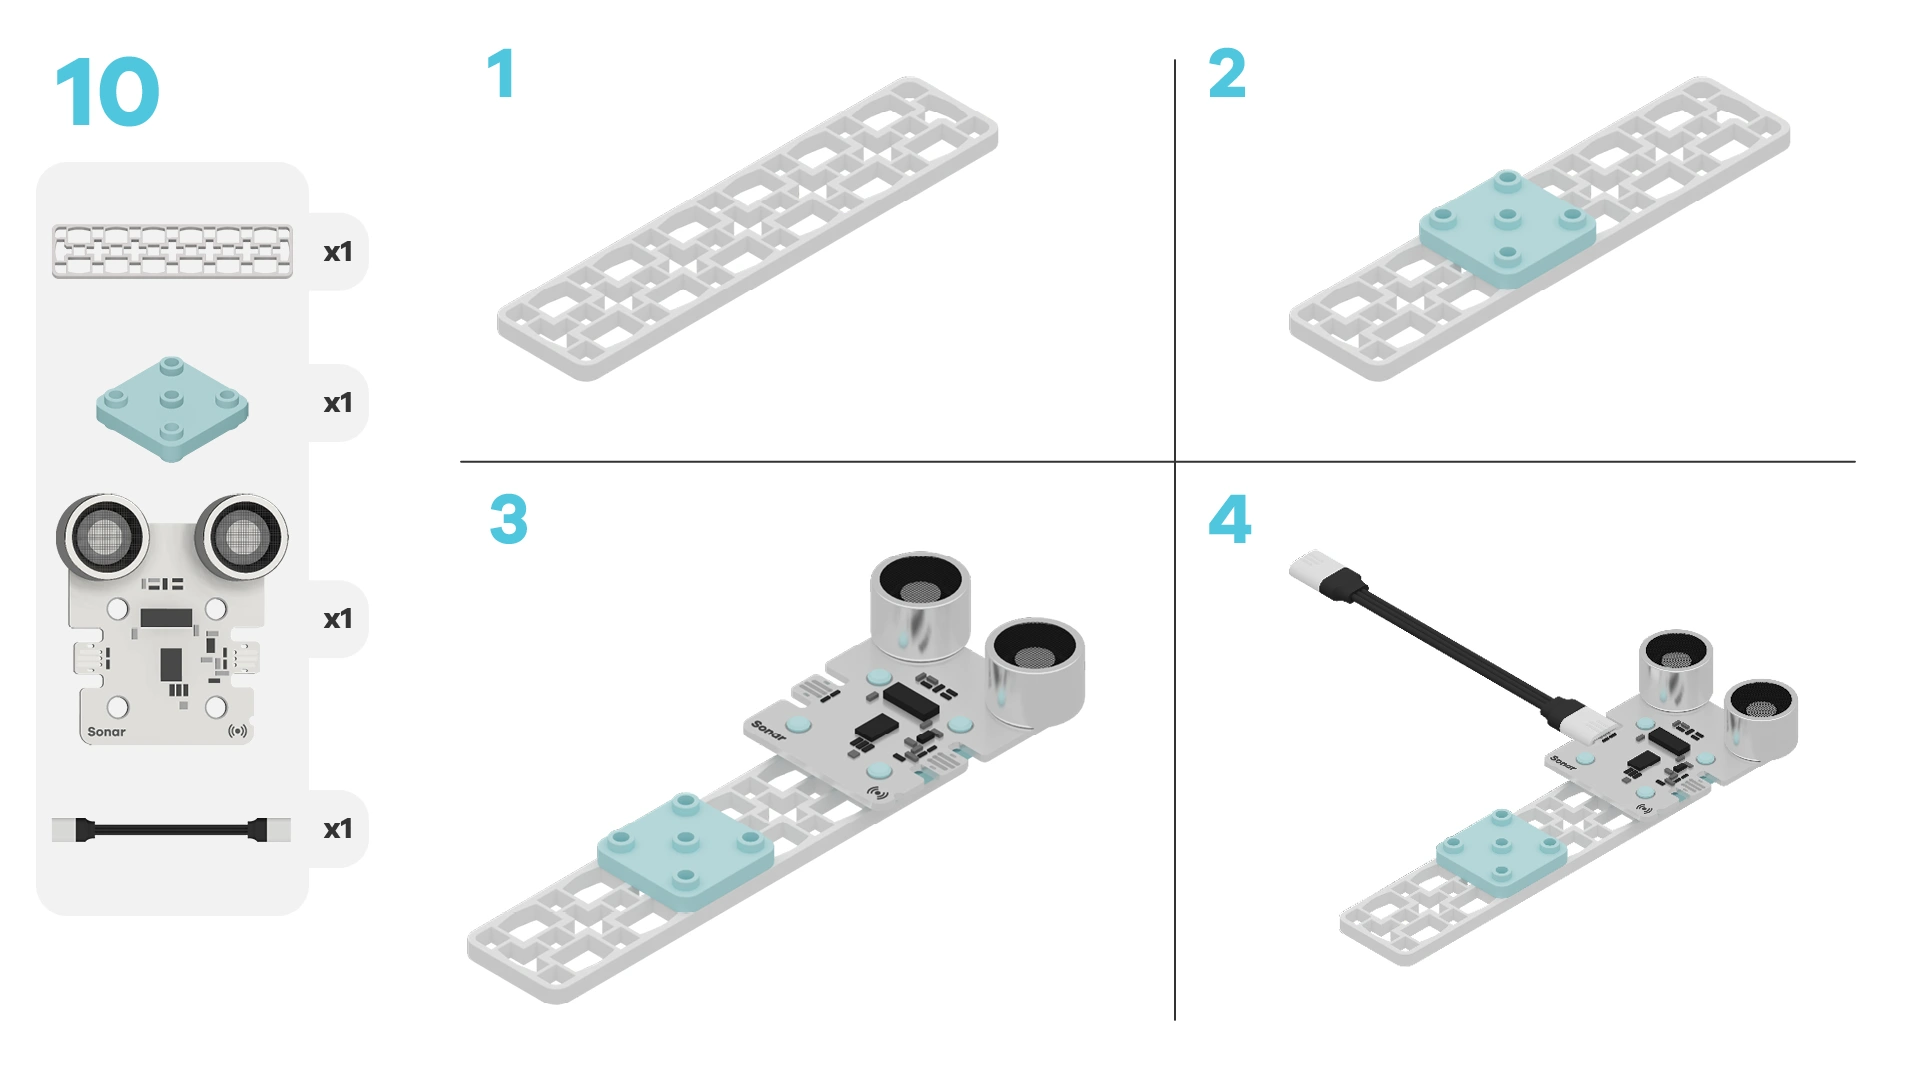
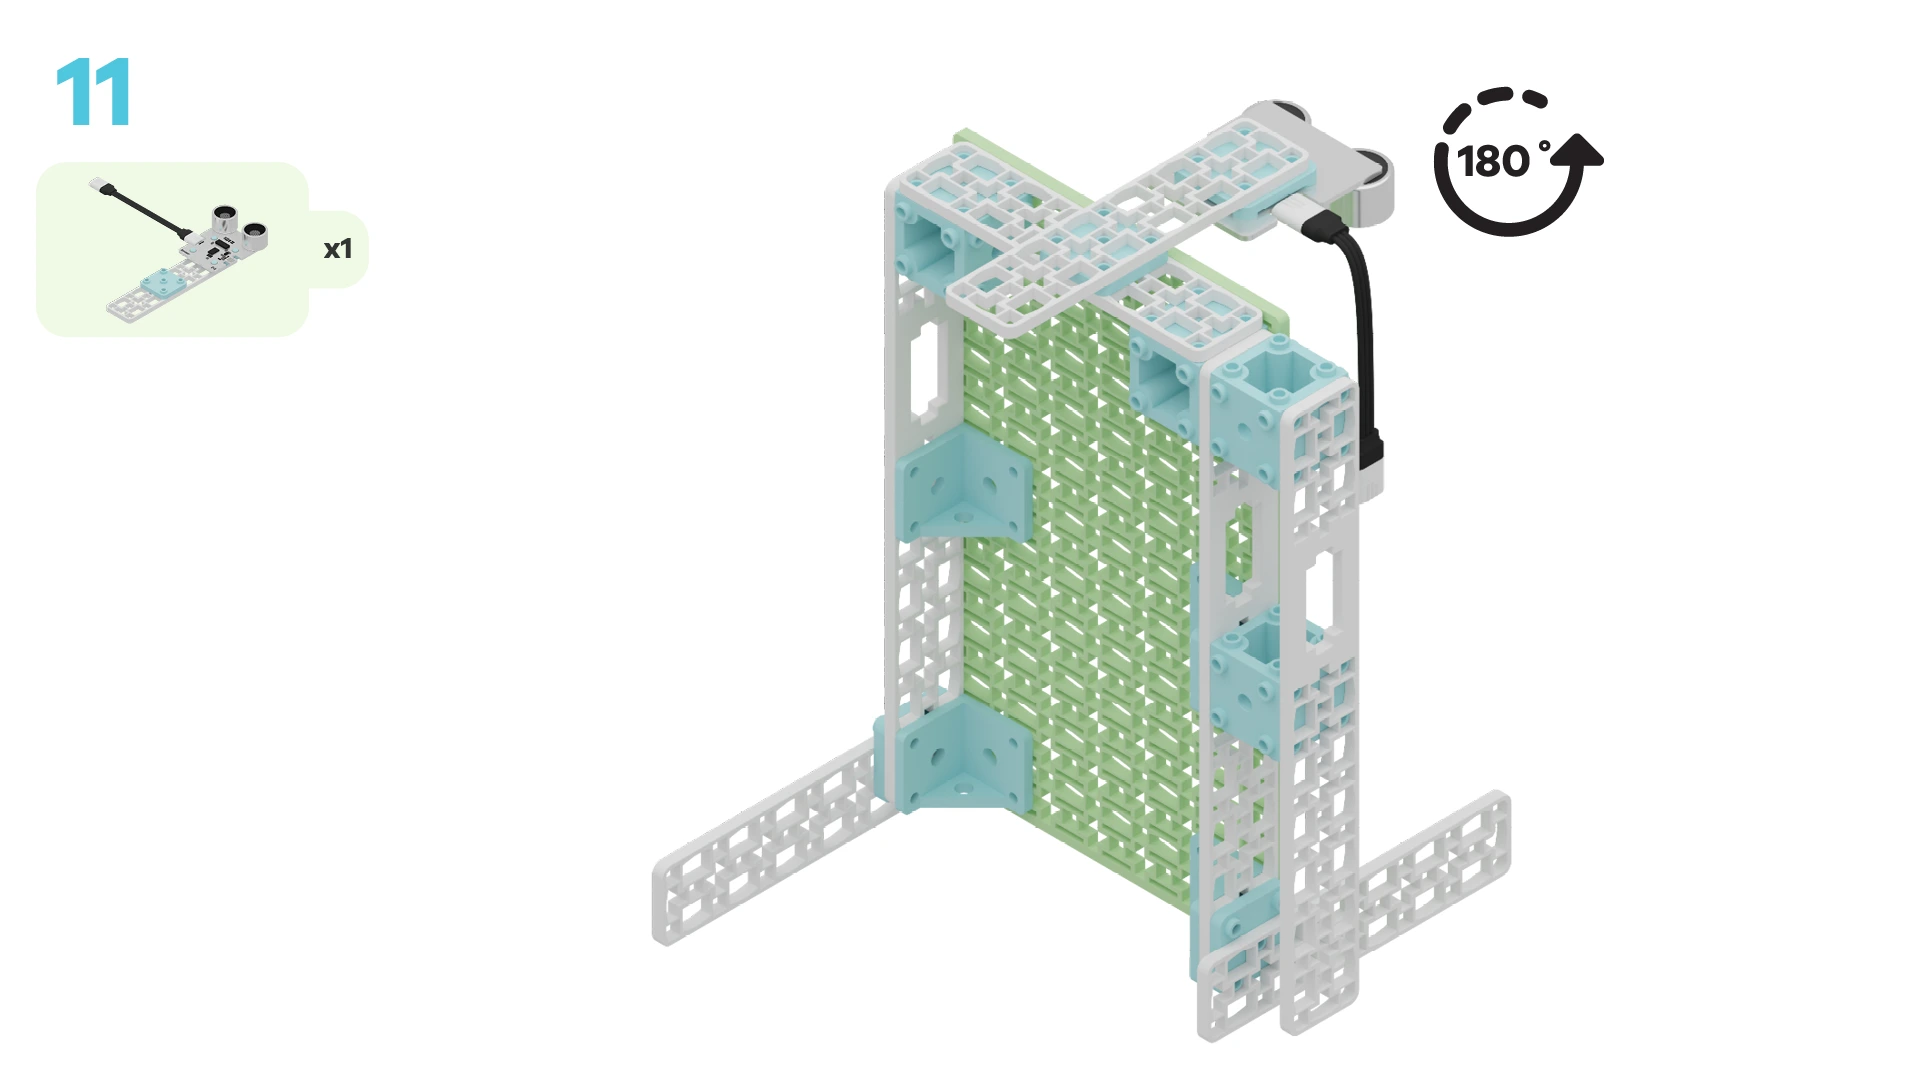
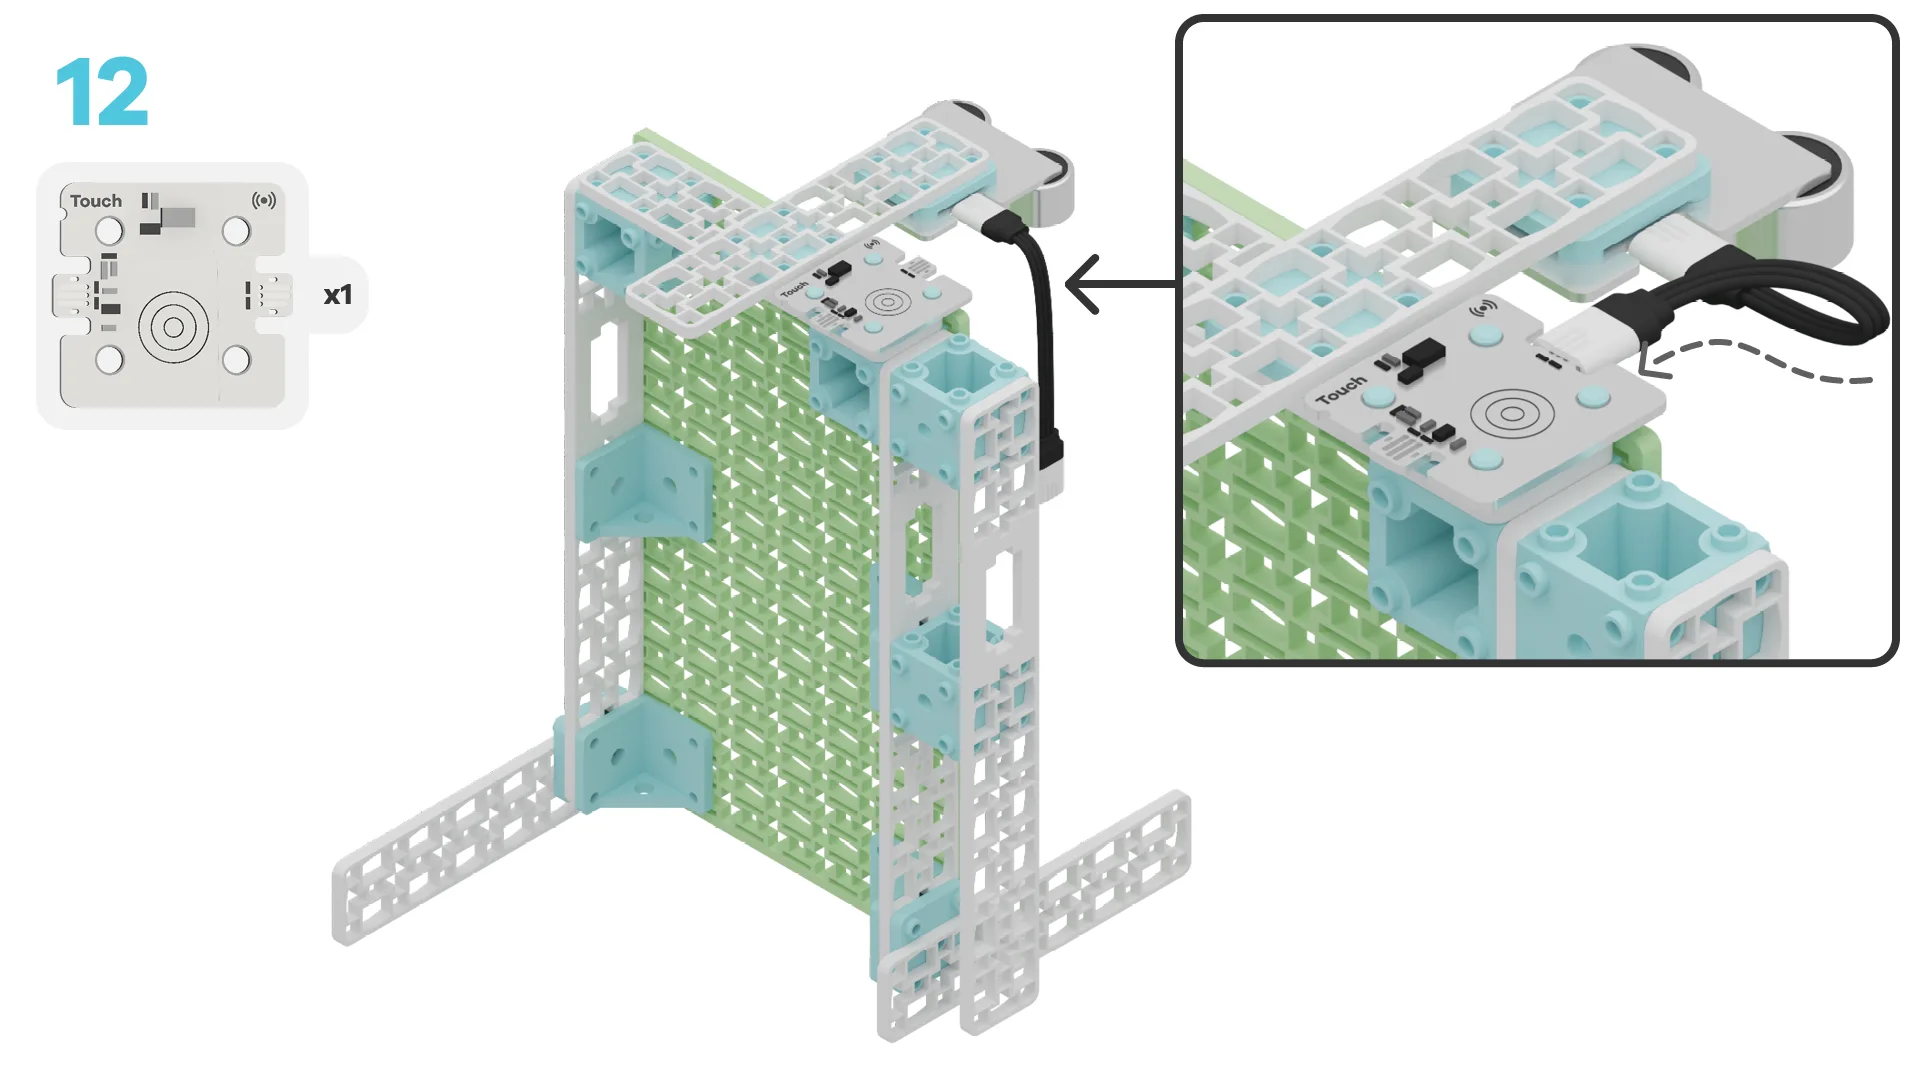
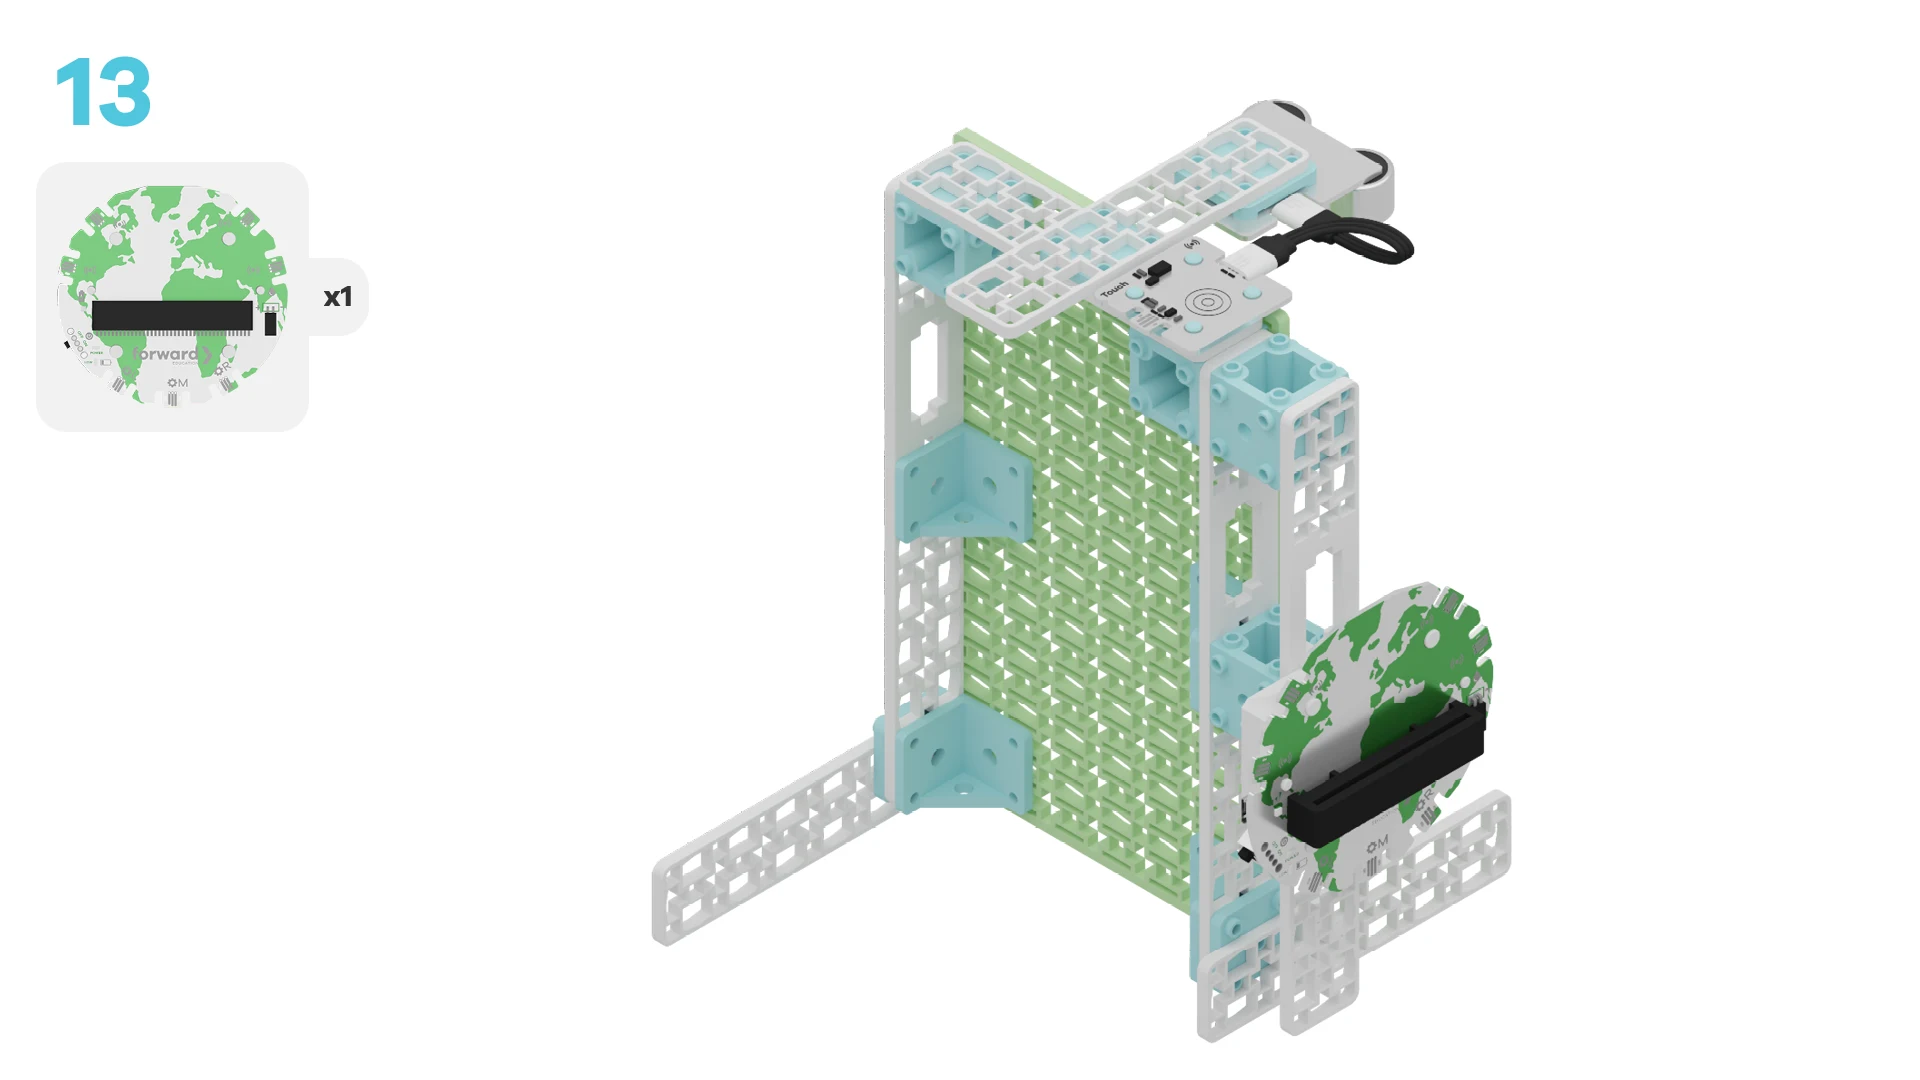
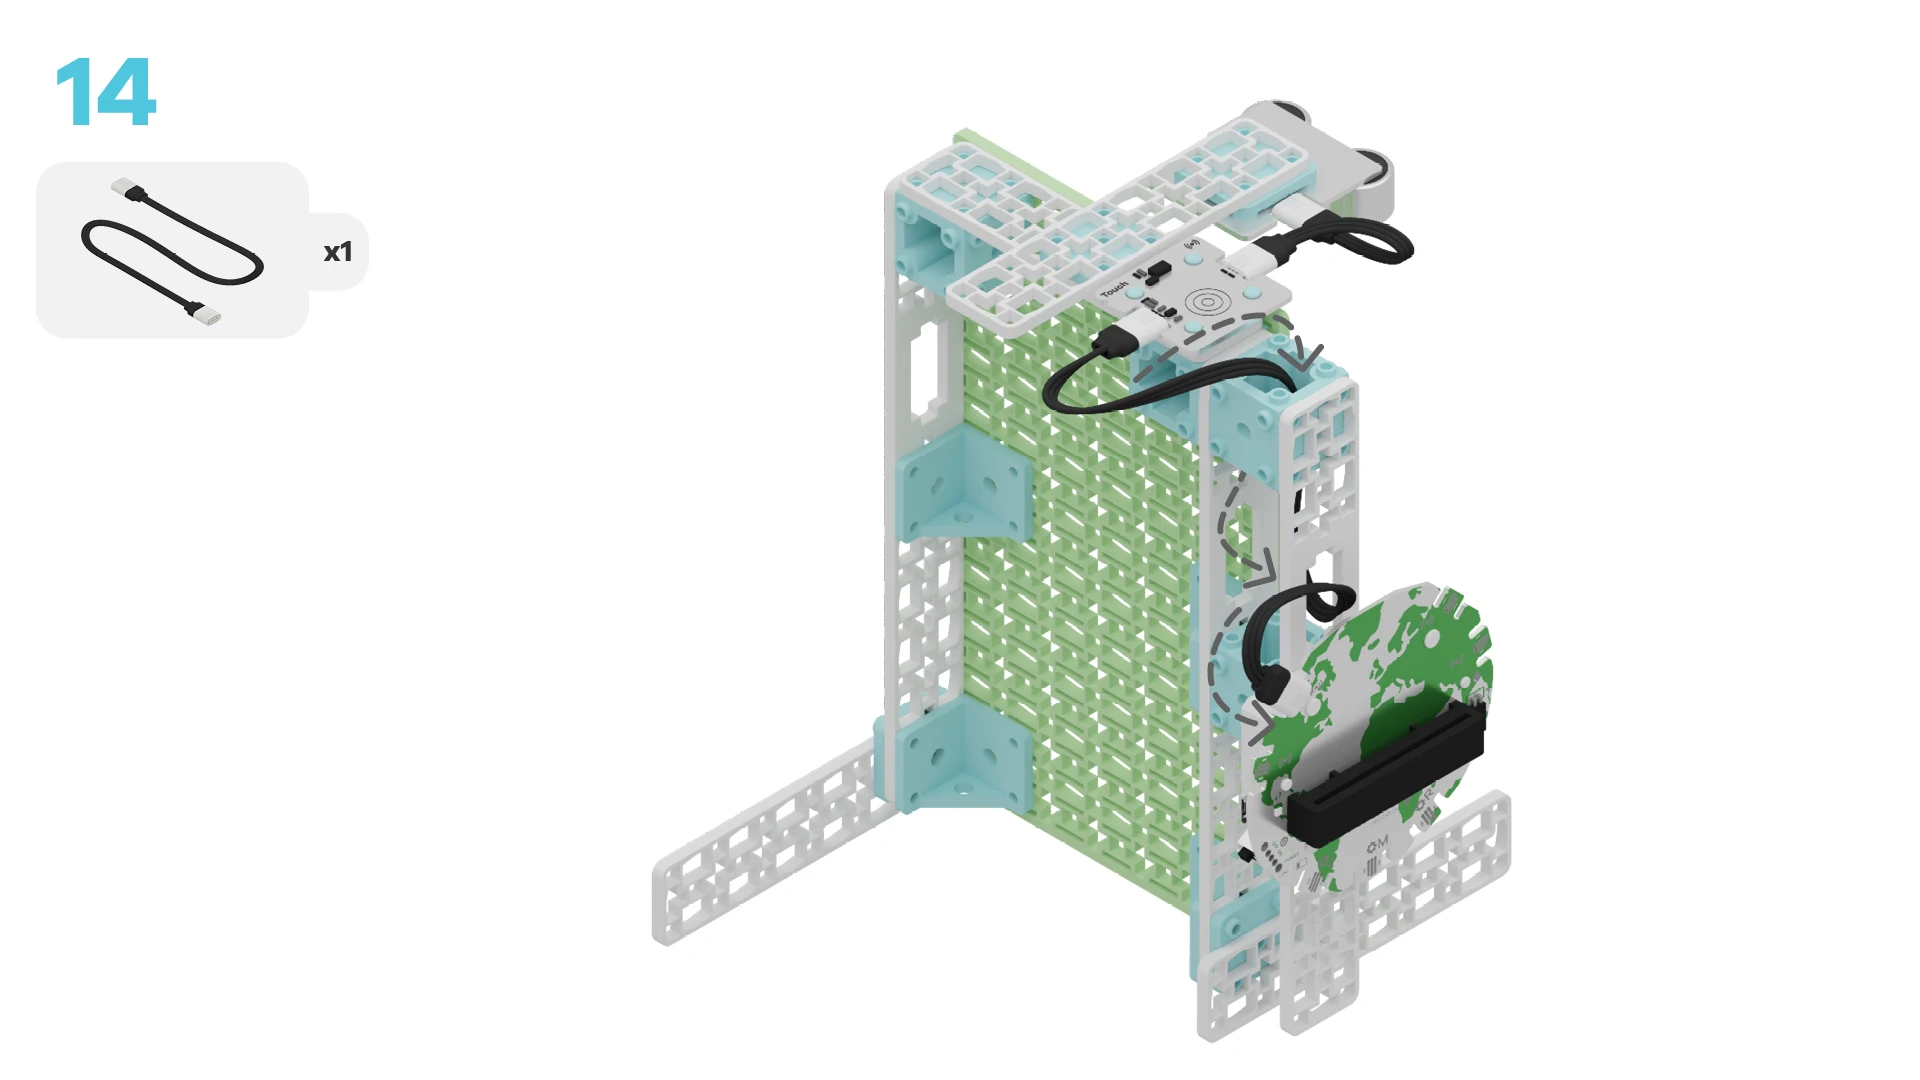
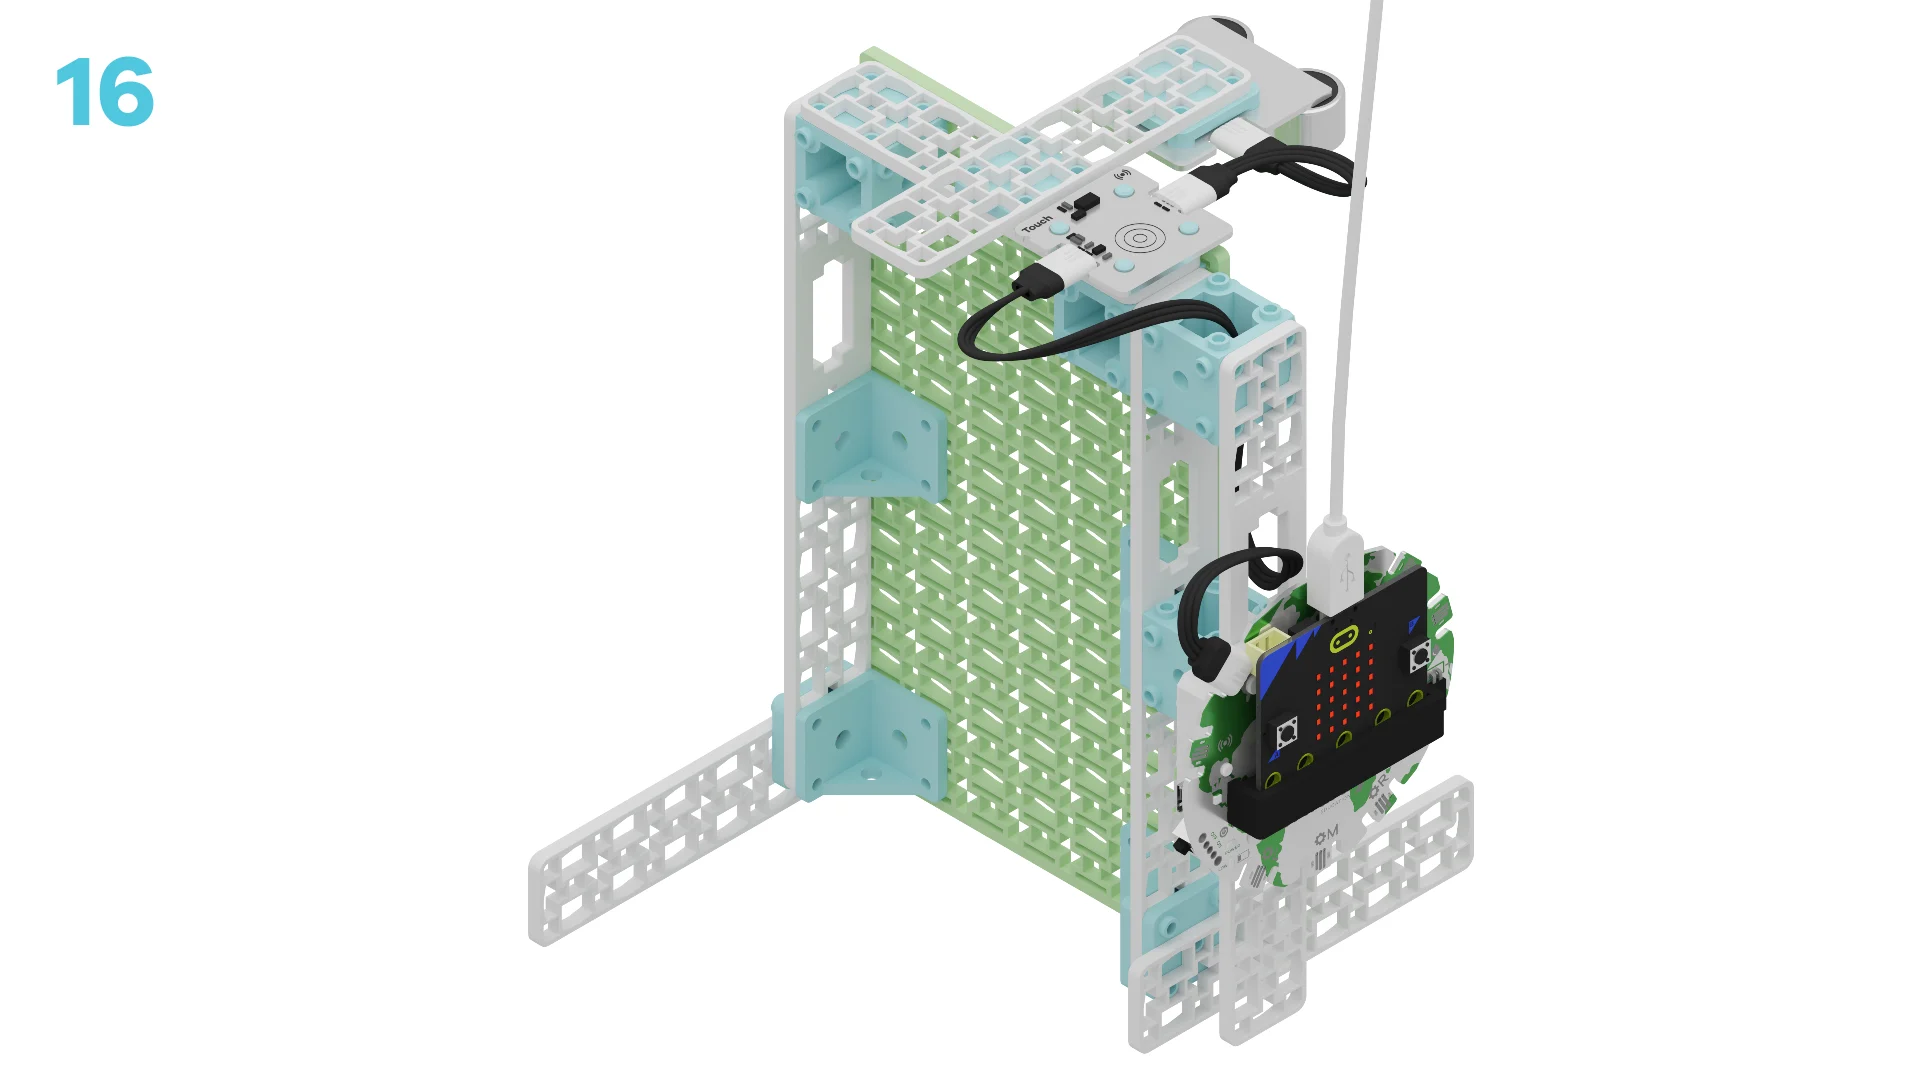
Let's build a satellite to monitor sea level change! We are going to do this in four parts:
- Build our satellite
- Add code to bring our project to life
- Modify our project to learn about other sensors
- Apply what we learned with a small experiment
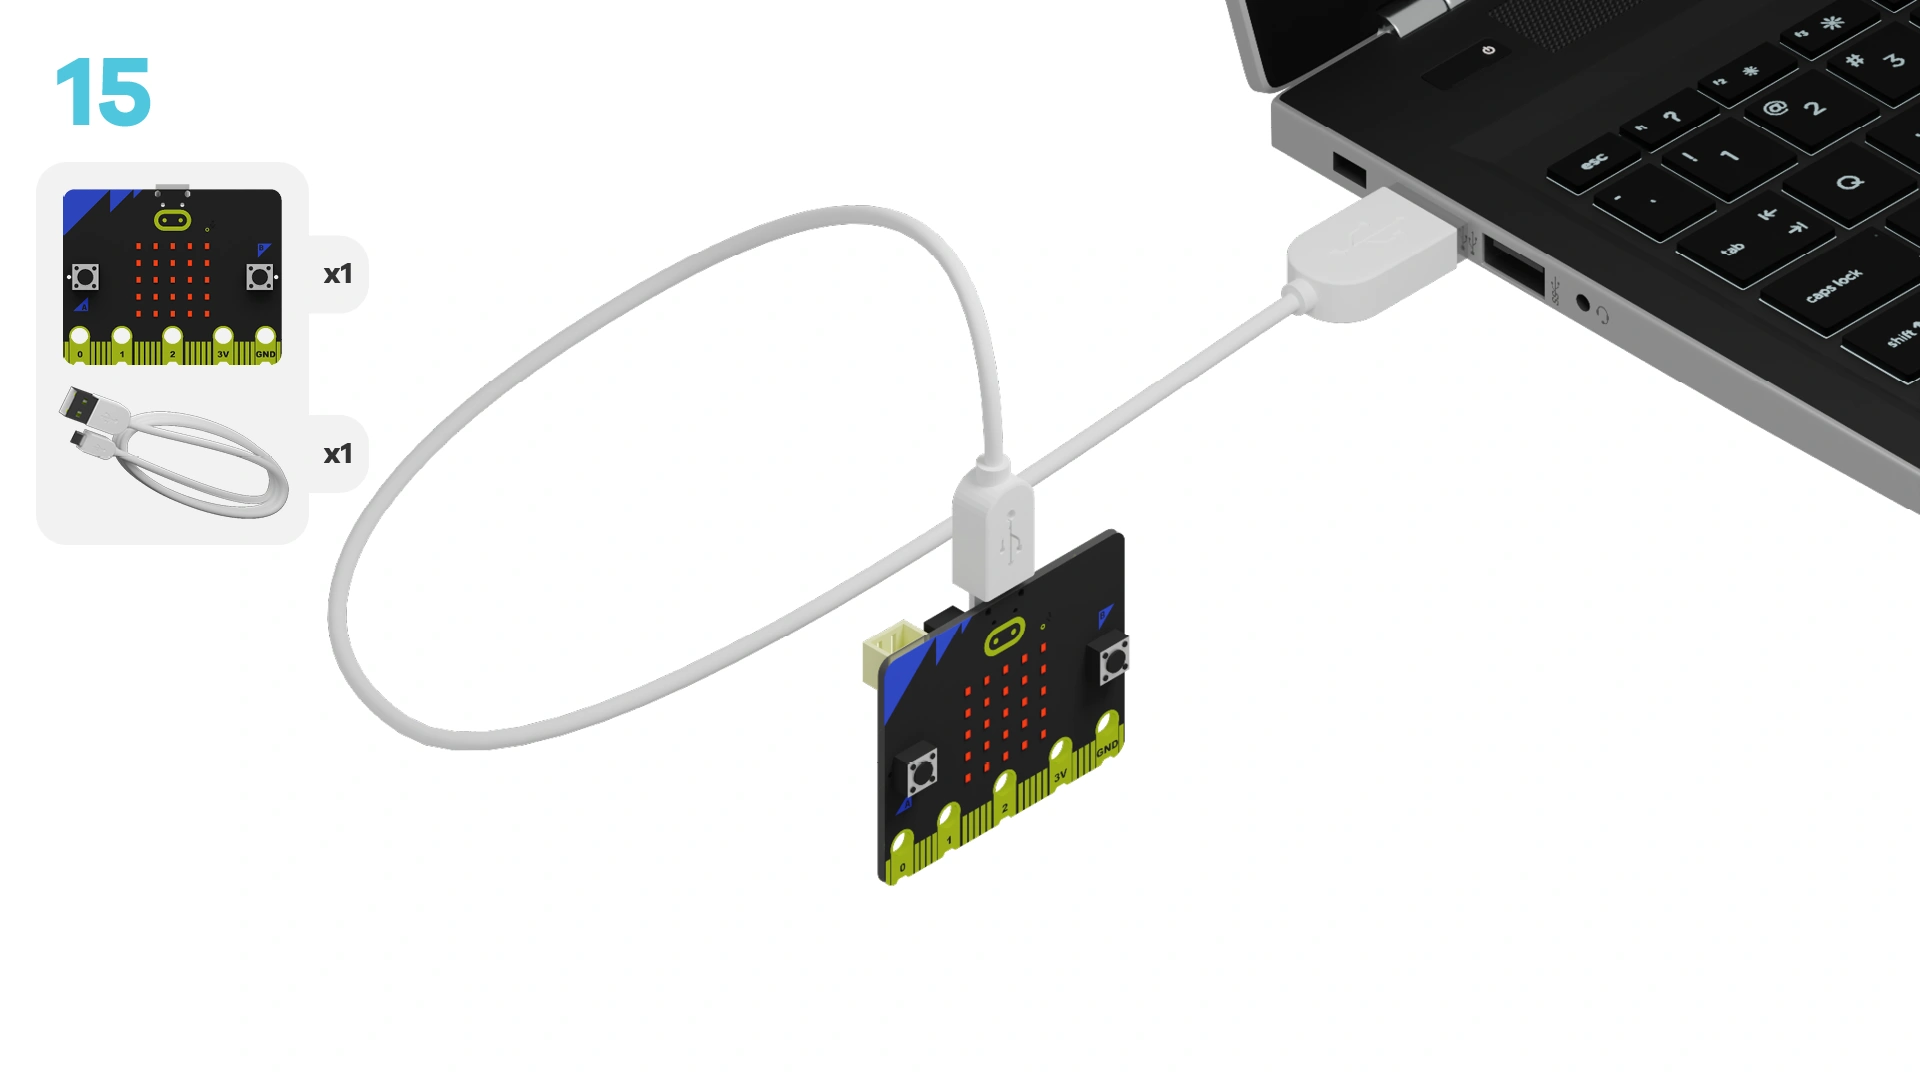
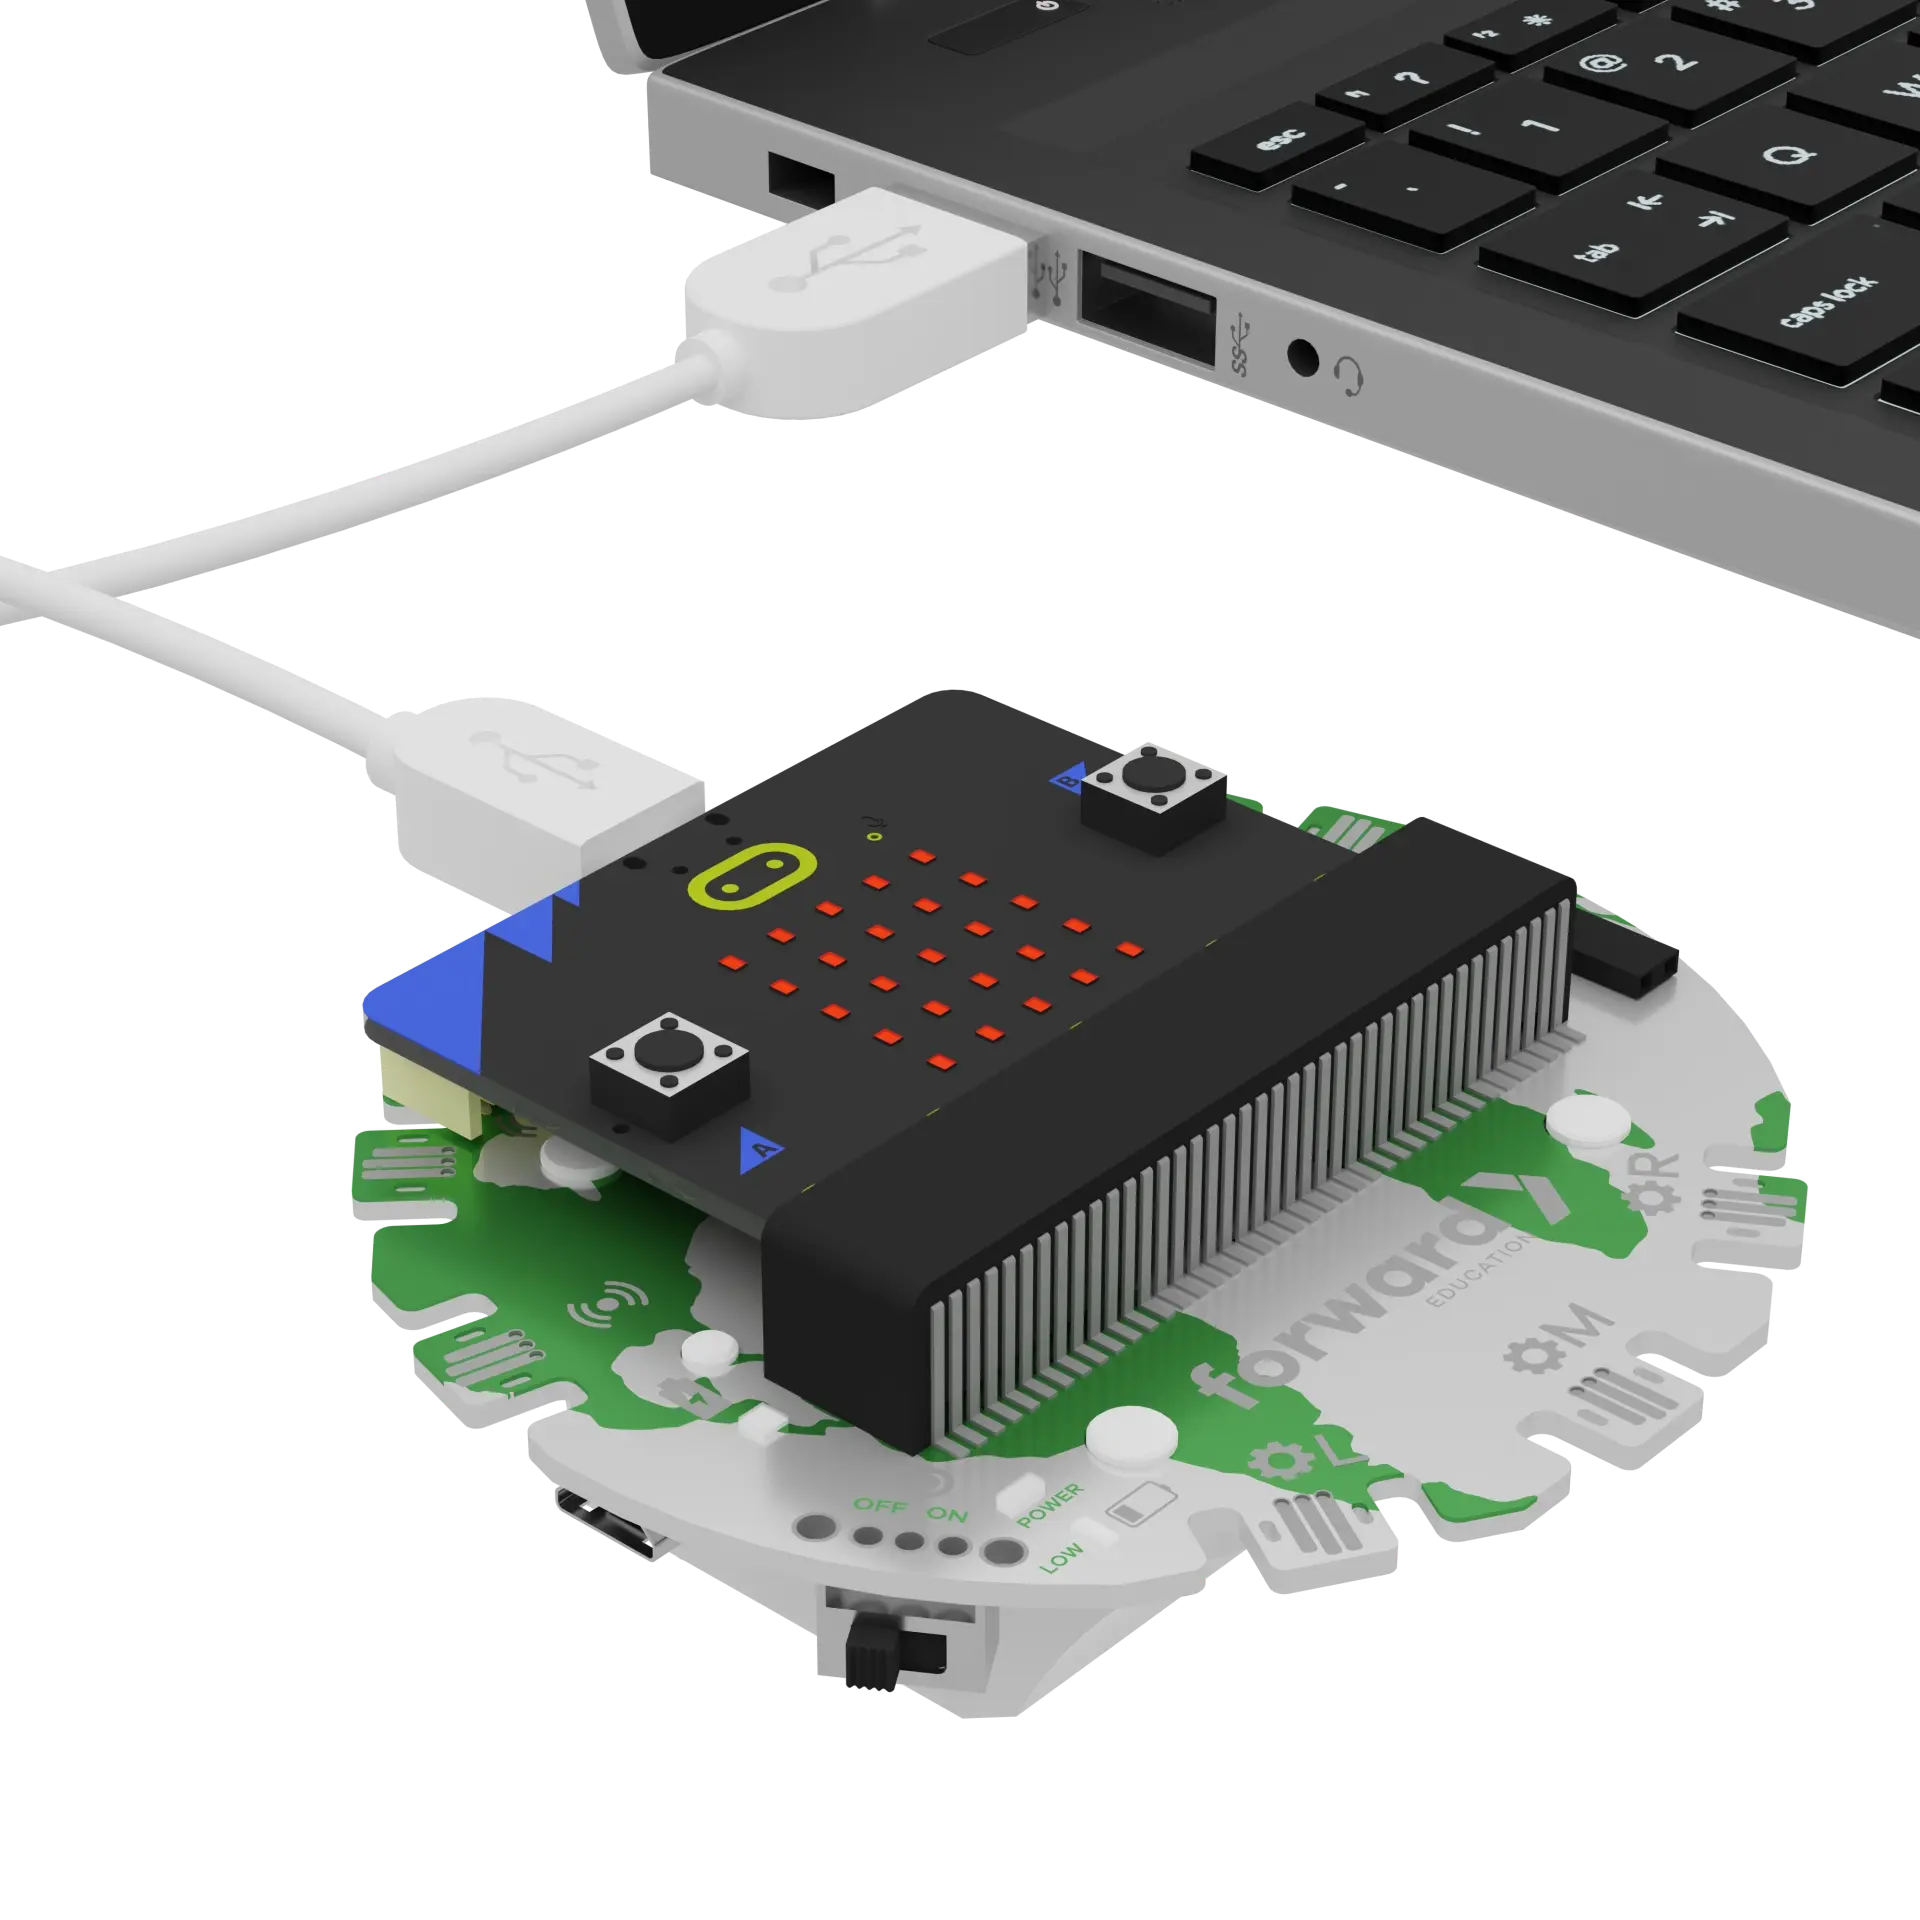
We need to connect our project to the computer to make it come to life with code!
The code will be the instructions that tell our micro:bit what to do.
IMPORTANT! Make sure your Climate Action Kit Breakout Board is turned on and your micro:bit is plugged into your computer.
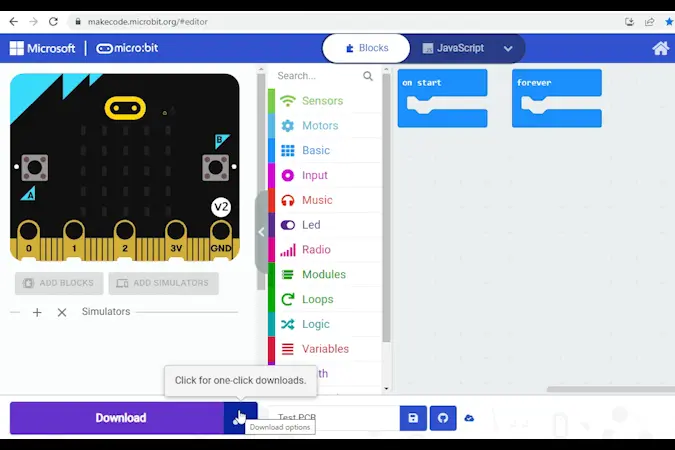
Click the three dots beside the |Download| button, then click on Connect Device.
Next, follow the steps to pair your micro:bit.
Click the |Download| button to download the starter code to your project.
We have a satellite that detects the water level and visualizes water level using the LED display. Let’s explore how to optimize our sensors by modifying our code!
As you go through the next steps:
- Use the instructions at the top of the screen to modify your code.
- When you are ready for more information, click 'Tell Me More!'
- If you need help with the code, click the lightbulb!
Let’s test out our satellite to see how it can monitor sea level change!
With your model on a table, gently move your hand between the table and the sonar sensor while looking at the LED display on the micro:bit.
What is happening?
~hint Tell Me More!
- When the distance between the table and the sonar sensor is bigger, more LEDs turn on!
- When the distance between your hand and the sonar sensor is smaller, fewer LEDs turn on! hint~
Can you identify the code block that is telling the code to control the LEDs on the micro:bit?
~hint Tell Me More!
- The micro:bit collects data from the sonar sensor.
- The code creates a graph between 0.3 meters and your hand. hint~
basic.forever(function () {
    WaterLevel = fwdSensors.sonar1.fwdDistance()
    basic.pause(1000)
   //@highlight
   led.plotBarGraph(
    WaterLevel,
    0.3
    )
})
Let's set up data logging to track sea water rise.
Data logging will let us compare how much ice has melted, to how much our ocean is rising. This data can help us identify patterns, like differences between land and sea ice, or how temperature affects the speed of ice melting.
We can use the blocks from the Data Logger Extension to record sea water level as ice melts.
In our code, we've already made sure we have a way to turn on data logs, and delete old data.
fwdSensors.touch.fwdOnTouch(jacdac.ButtonEvent.Down, function () {
    // @highlight
    Logging = true
    music.play(music.tonePlayable(262, music.beat(BeatFraction.Double)), music.PlaybackMode.UntilDone)
})

input.onButtonPressed(Button.AB, function () {
  // @highlight
    datalogger.deleteLog()
    music.play(music.tonePlayable(131, music.beat(BeatFraction.Double)), music.PlaybackMode.UntilDone)
})
Use the ||Datalogger:log data|| block to save the ||fwdSensors:sonar distance|| data as your ice is melting. Remember to name your column "Water Level".
    loops.everyInterval(1000, function () {
    // @highlight
    datalogger.log(datalogger.createCV("Water Level", fwdSensors.sonar1.fwdDistance()))
})
Let's reduce how often our data is being recorded.
Select the dropdown on the ||loops:everyInterval|| block. What do you think a better frequency to log our ice melting is?
hint Tell Me More!
Try selecting once every minute, or 60,000 milliseconds.
hint
// @highlight
    loops.everyInterval(60000, function () {
       datalogger.log(datalogger.createCV("Water Level", fwdSensors.sonar1.fwdDistance()))
})
Now that we have modified our code to understand how our satellite collects data, we're going to add water!
Remember to press the |Download| button to download our modified code.
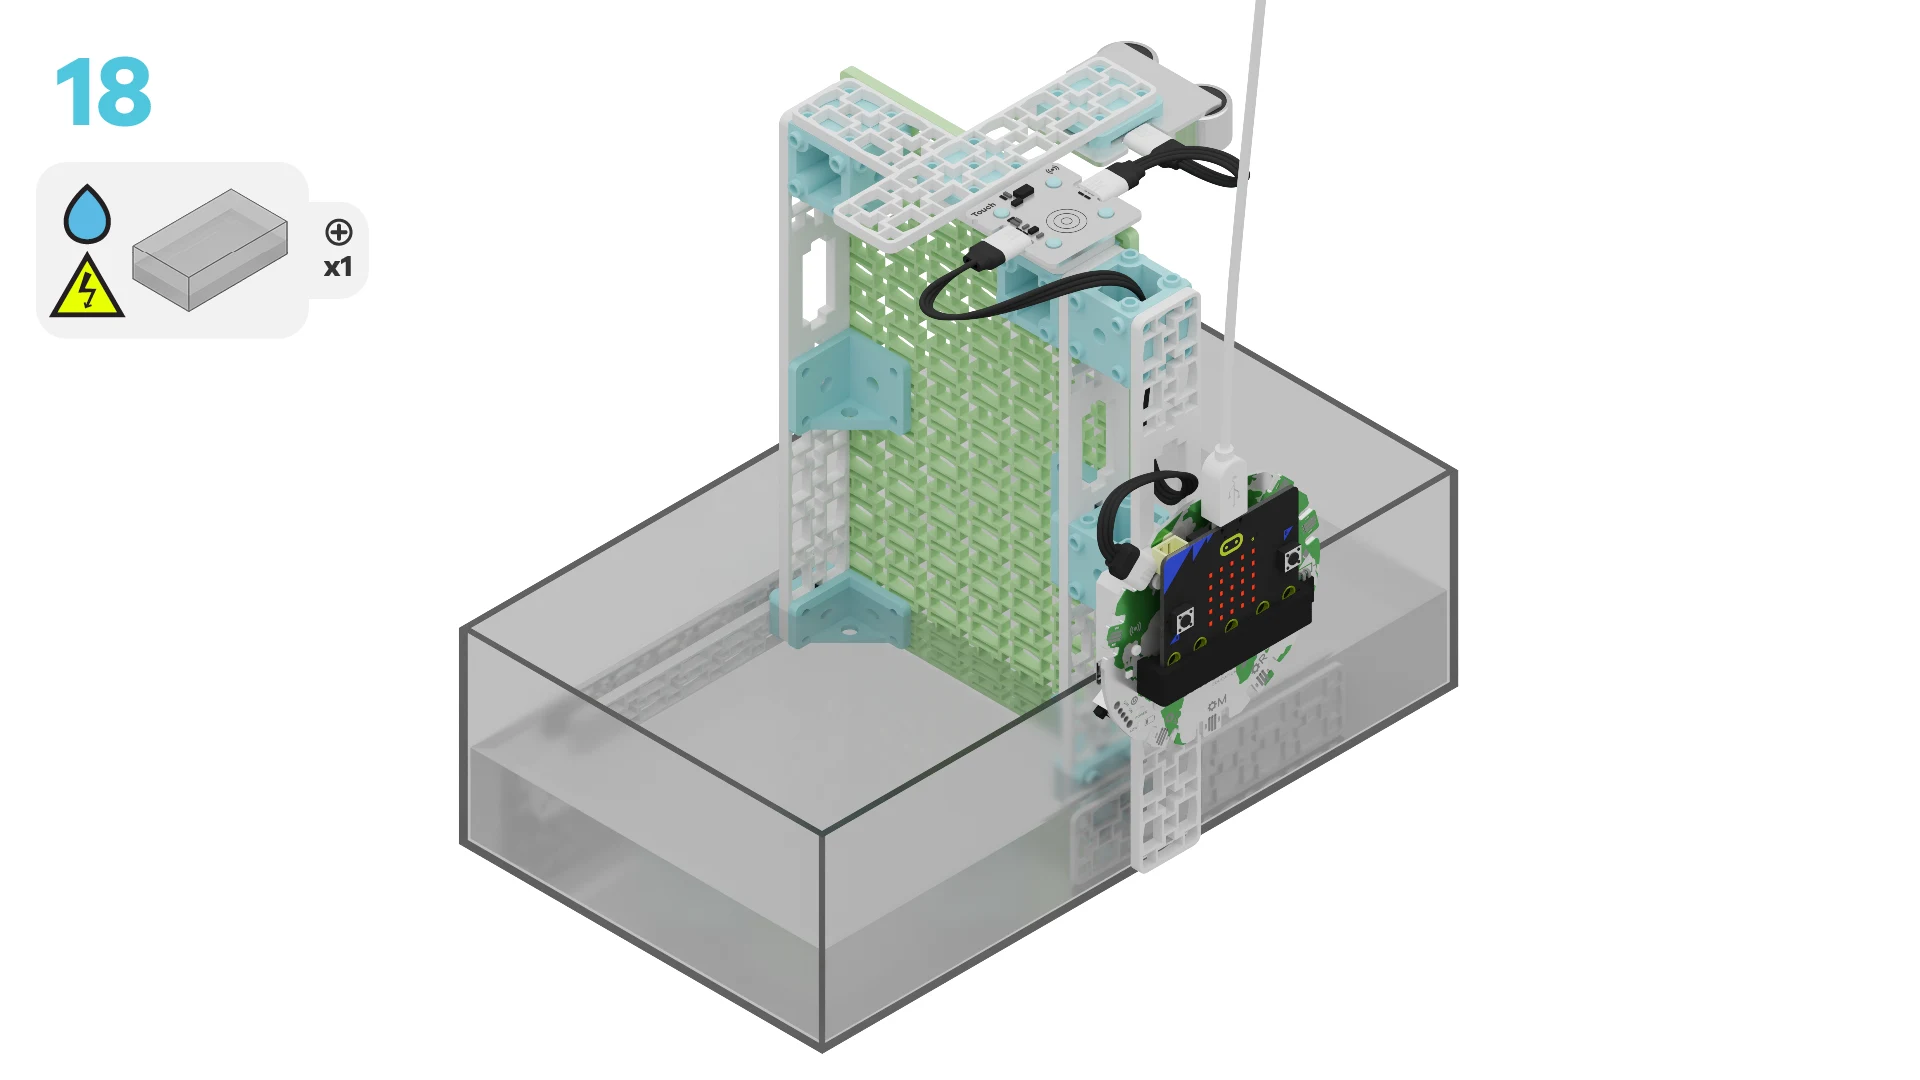
Important! Remember that our project uses electronic wires and sensors that should not get wet! If any part other than the building blocks get wet, turn off your project and fully dry it before continuing.
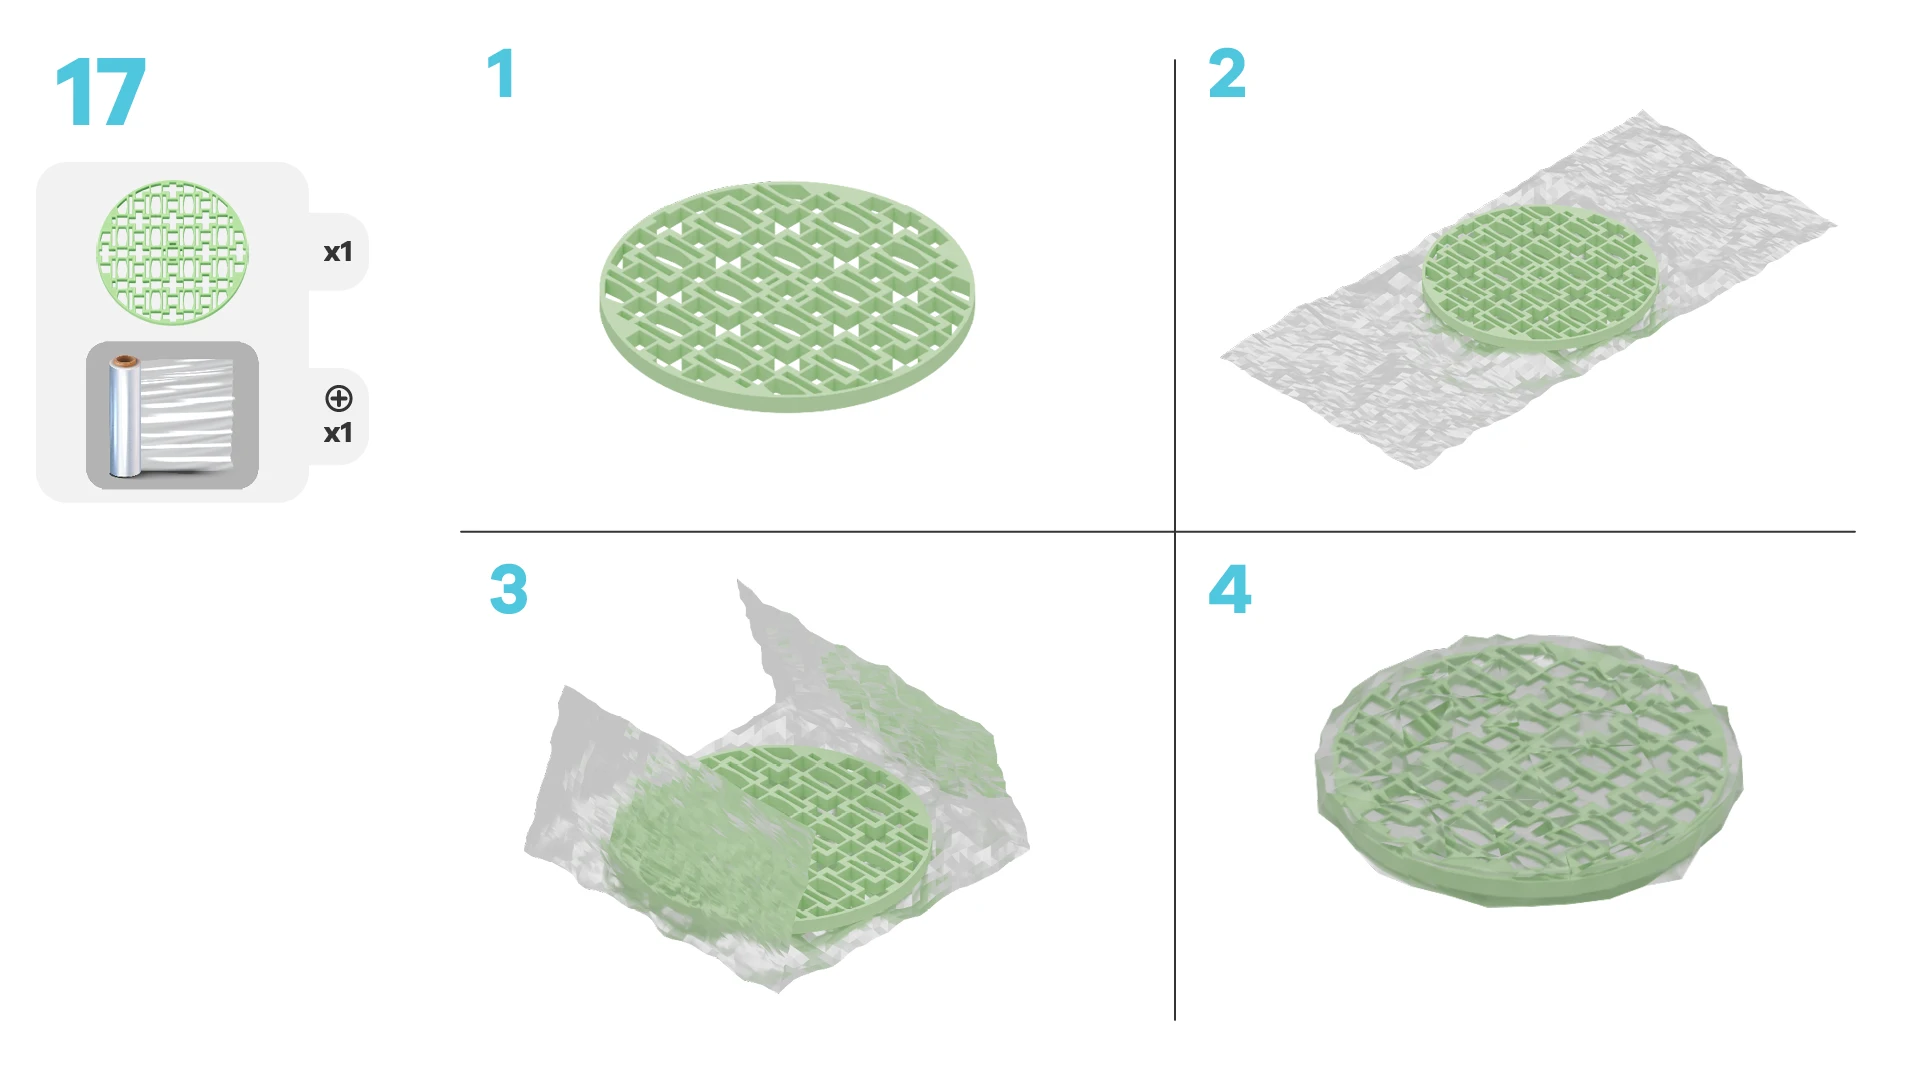
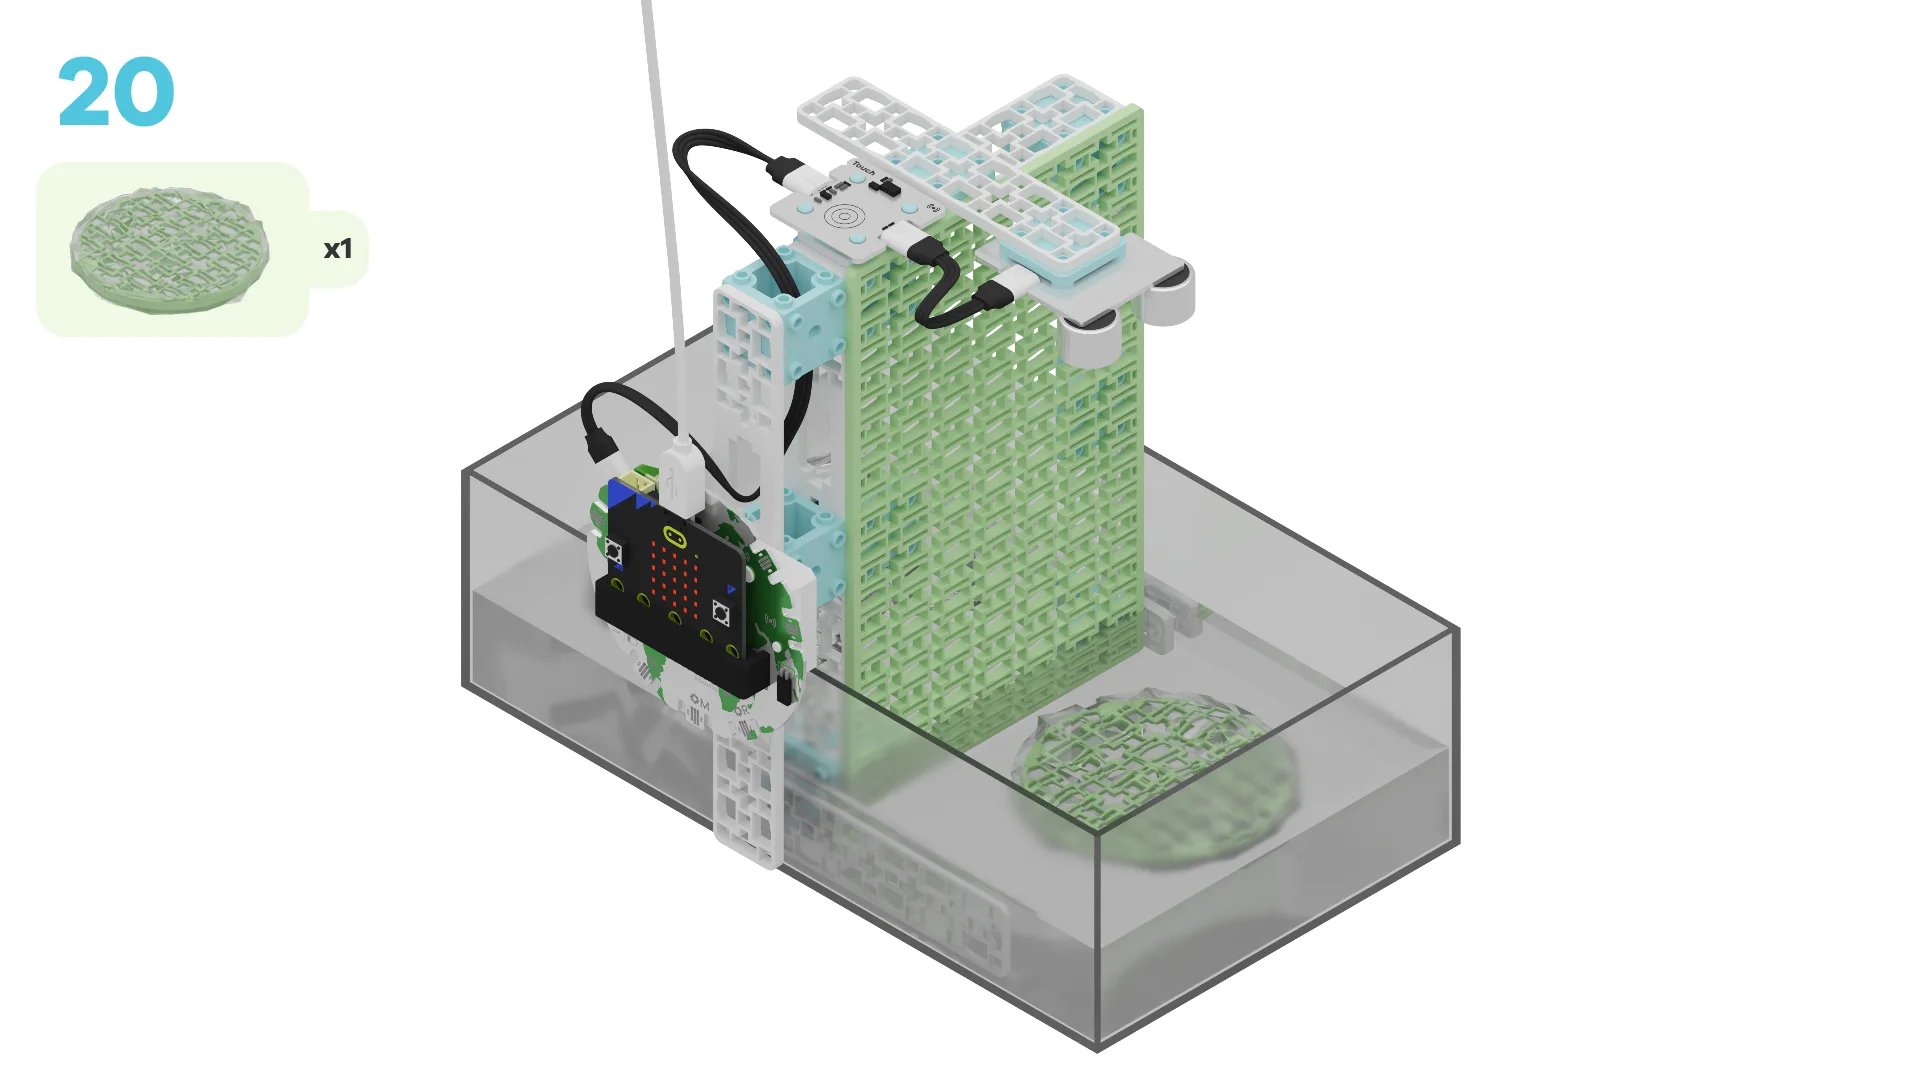
To help your green circular building block float in water, wrap it with plastic wrap.
Place your model in a water tight container filled 1/4 full with cold water.
Be careful not to drop any electronic components into the water.
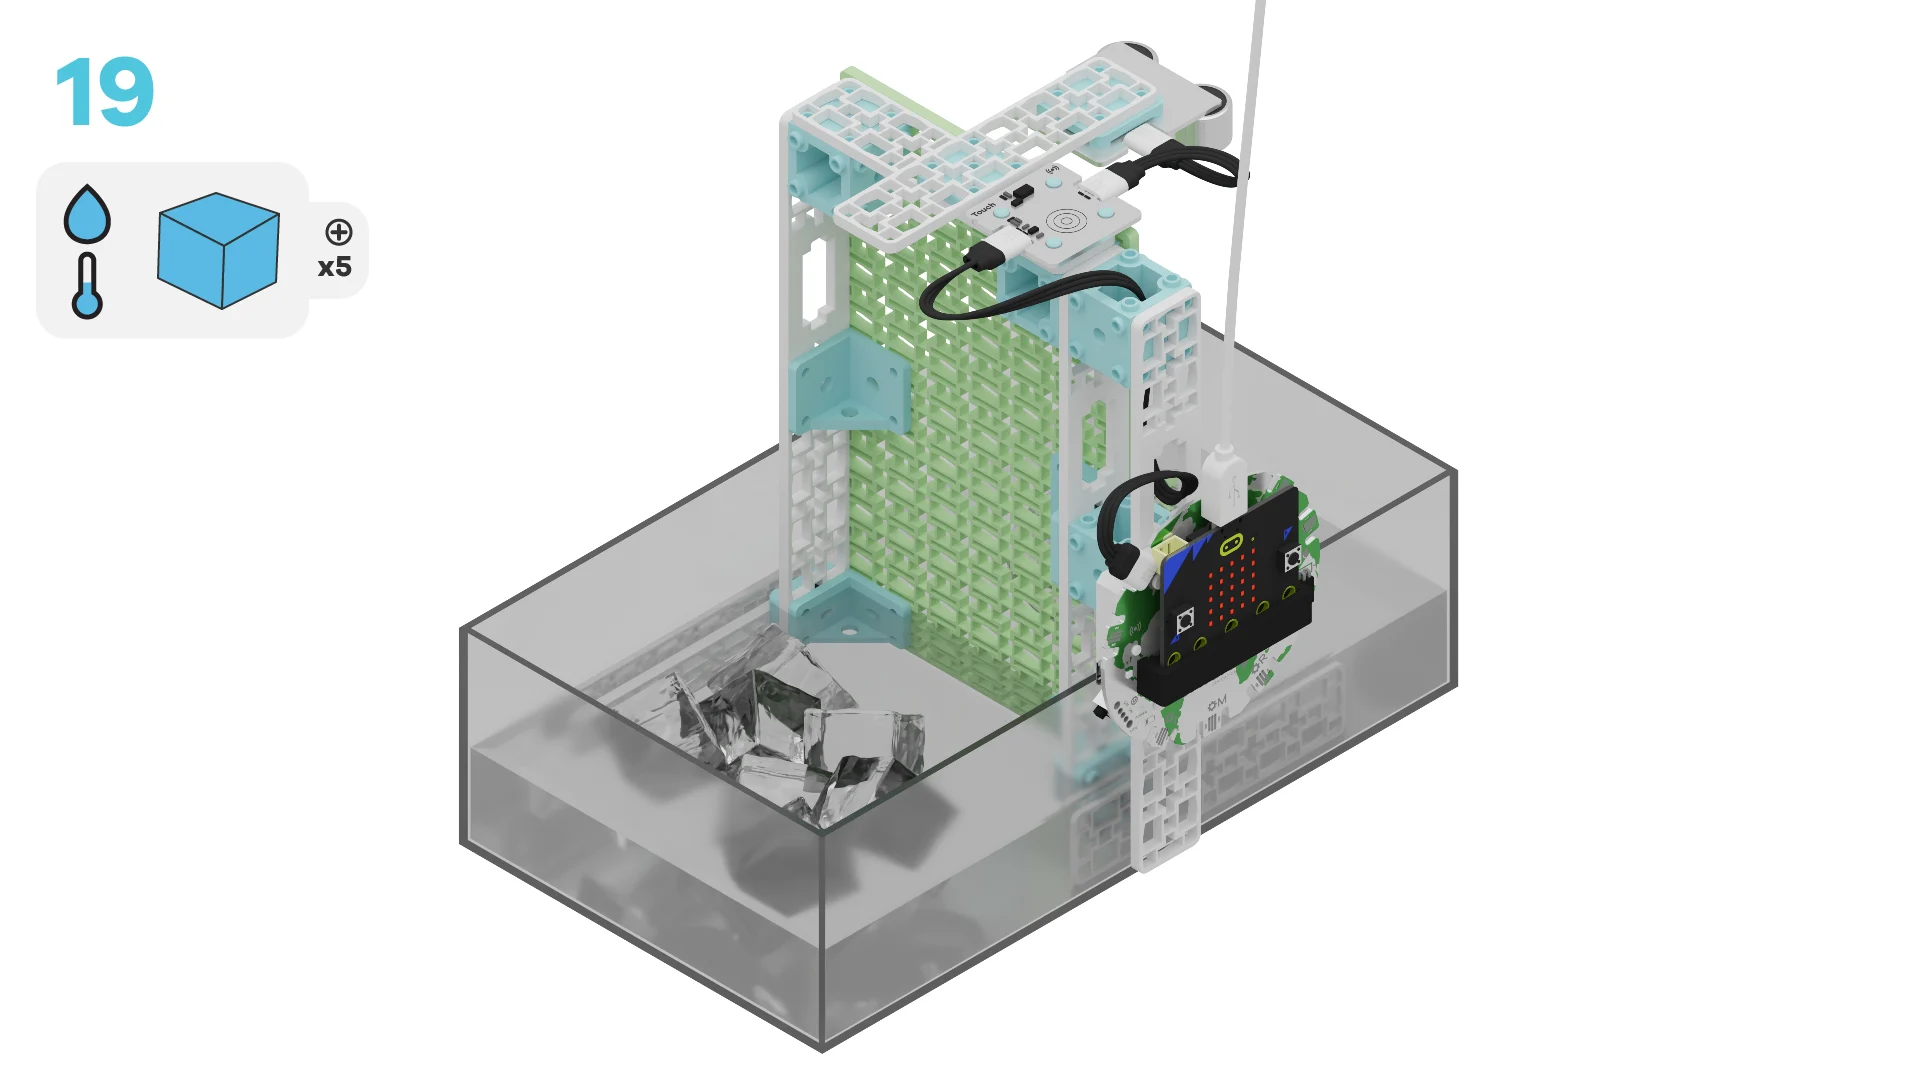
Fill one side of your container full of ice.
The large green rectangular building block should stop the ice from getting to the other side of the container.
Place your green circular building block on the opposite side of the container.
The circular block is like our hand, it should sit in the container underneath the sonar sensor.
Leave your micro:bit on in your container of ice and water, what do you think will happen to the LEDs as the ice melts?
Write your prediction down!
Now it’s time to test your prediction!
Press the A and B buttons on your micro:bit to delete any old logs. Then, press the touch sensor to turn on your data logger.
~hint Tell Me More! As the ice melts and the water rises
- Our data logger will record the level of the sonar sensor into a table we can look at later.
- Fewer LEDs will light up.
Depending on the size of your container, the water will rise more or less as your ice melts. hint~
How quickly did the ice melt with the cold water?
Plug the micro:bit back in and view the log data.
Create a copy of your data log, and save it somewhere on your computer later.
Get a new container with the same amount of ice but this time, use hot water.
How quickly do you think that your ice will melt with the warmer water? Write your prediction down!
hint Tell Me More!
Remember to use the same amount of ice and water so that you can compare the level of water rising over time.
hint
Once your ice has melted, plug your micro:bit back into your computer and view the log data.
Save your data log on your computer for the next step.
How do your two data logs compare? Create a graph to visualize your water level experiment.
~hint Tell Me More! You may choose to create a bar or a line graph, with the following axes:
- X: Time
- Y: Percentage of ice melted
- Colour of line/bar: Cool Water versus Hot Water hint~
You've completed the activity!
Did anything surprise you about the project?
-
How did using predictions and data collection help you better understand your code?
-
How do you think a different amount of ice would change the results of your experiment?
-
How did the temperature of the water influence the speed of ice melting?
In the next step, you can click the |Done| button to finish the tutorial.
