fwd-edu-breakout=github:climate-action-kits/pxt-fwd-edu/fwd-breakout
sonar=github:climate-action-kits/pxt-fwd-edu
datalogger=datalogger
datalogger.setColumnTitles("Light Level (%)")
fwdSensors.ledRing.fwdSetBrightness(10)
fwdSensors.ledRing.fwdSetAllPixelsColour(0xffffff)
basic.forever(function () {
    if (input.buttonIsPressed(Button.B)) {
        datalogger.log(datalogger.createCV("Light Level (%)", fwdSensors.solar1.fwdLightLevel()))
    }
})
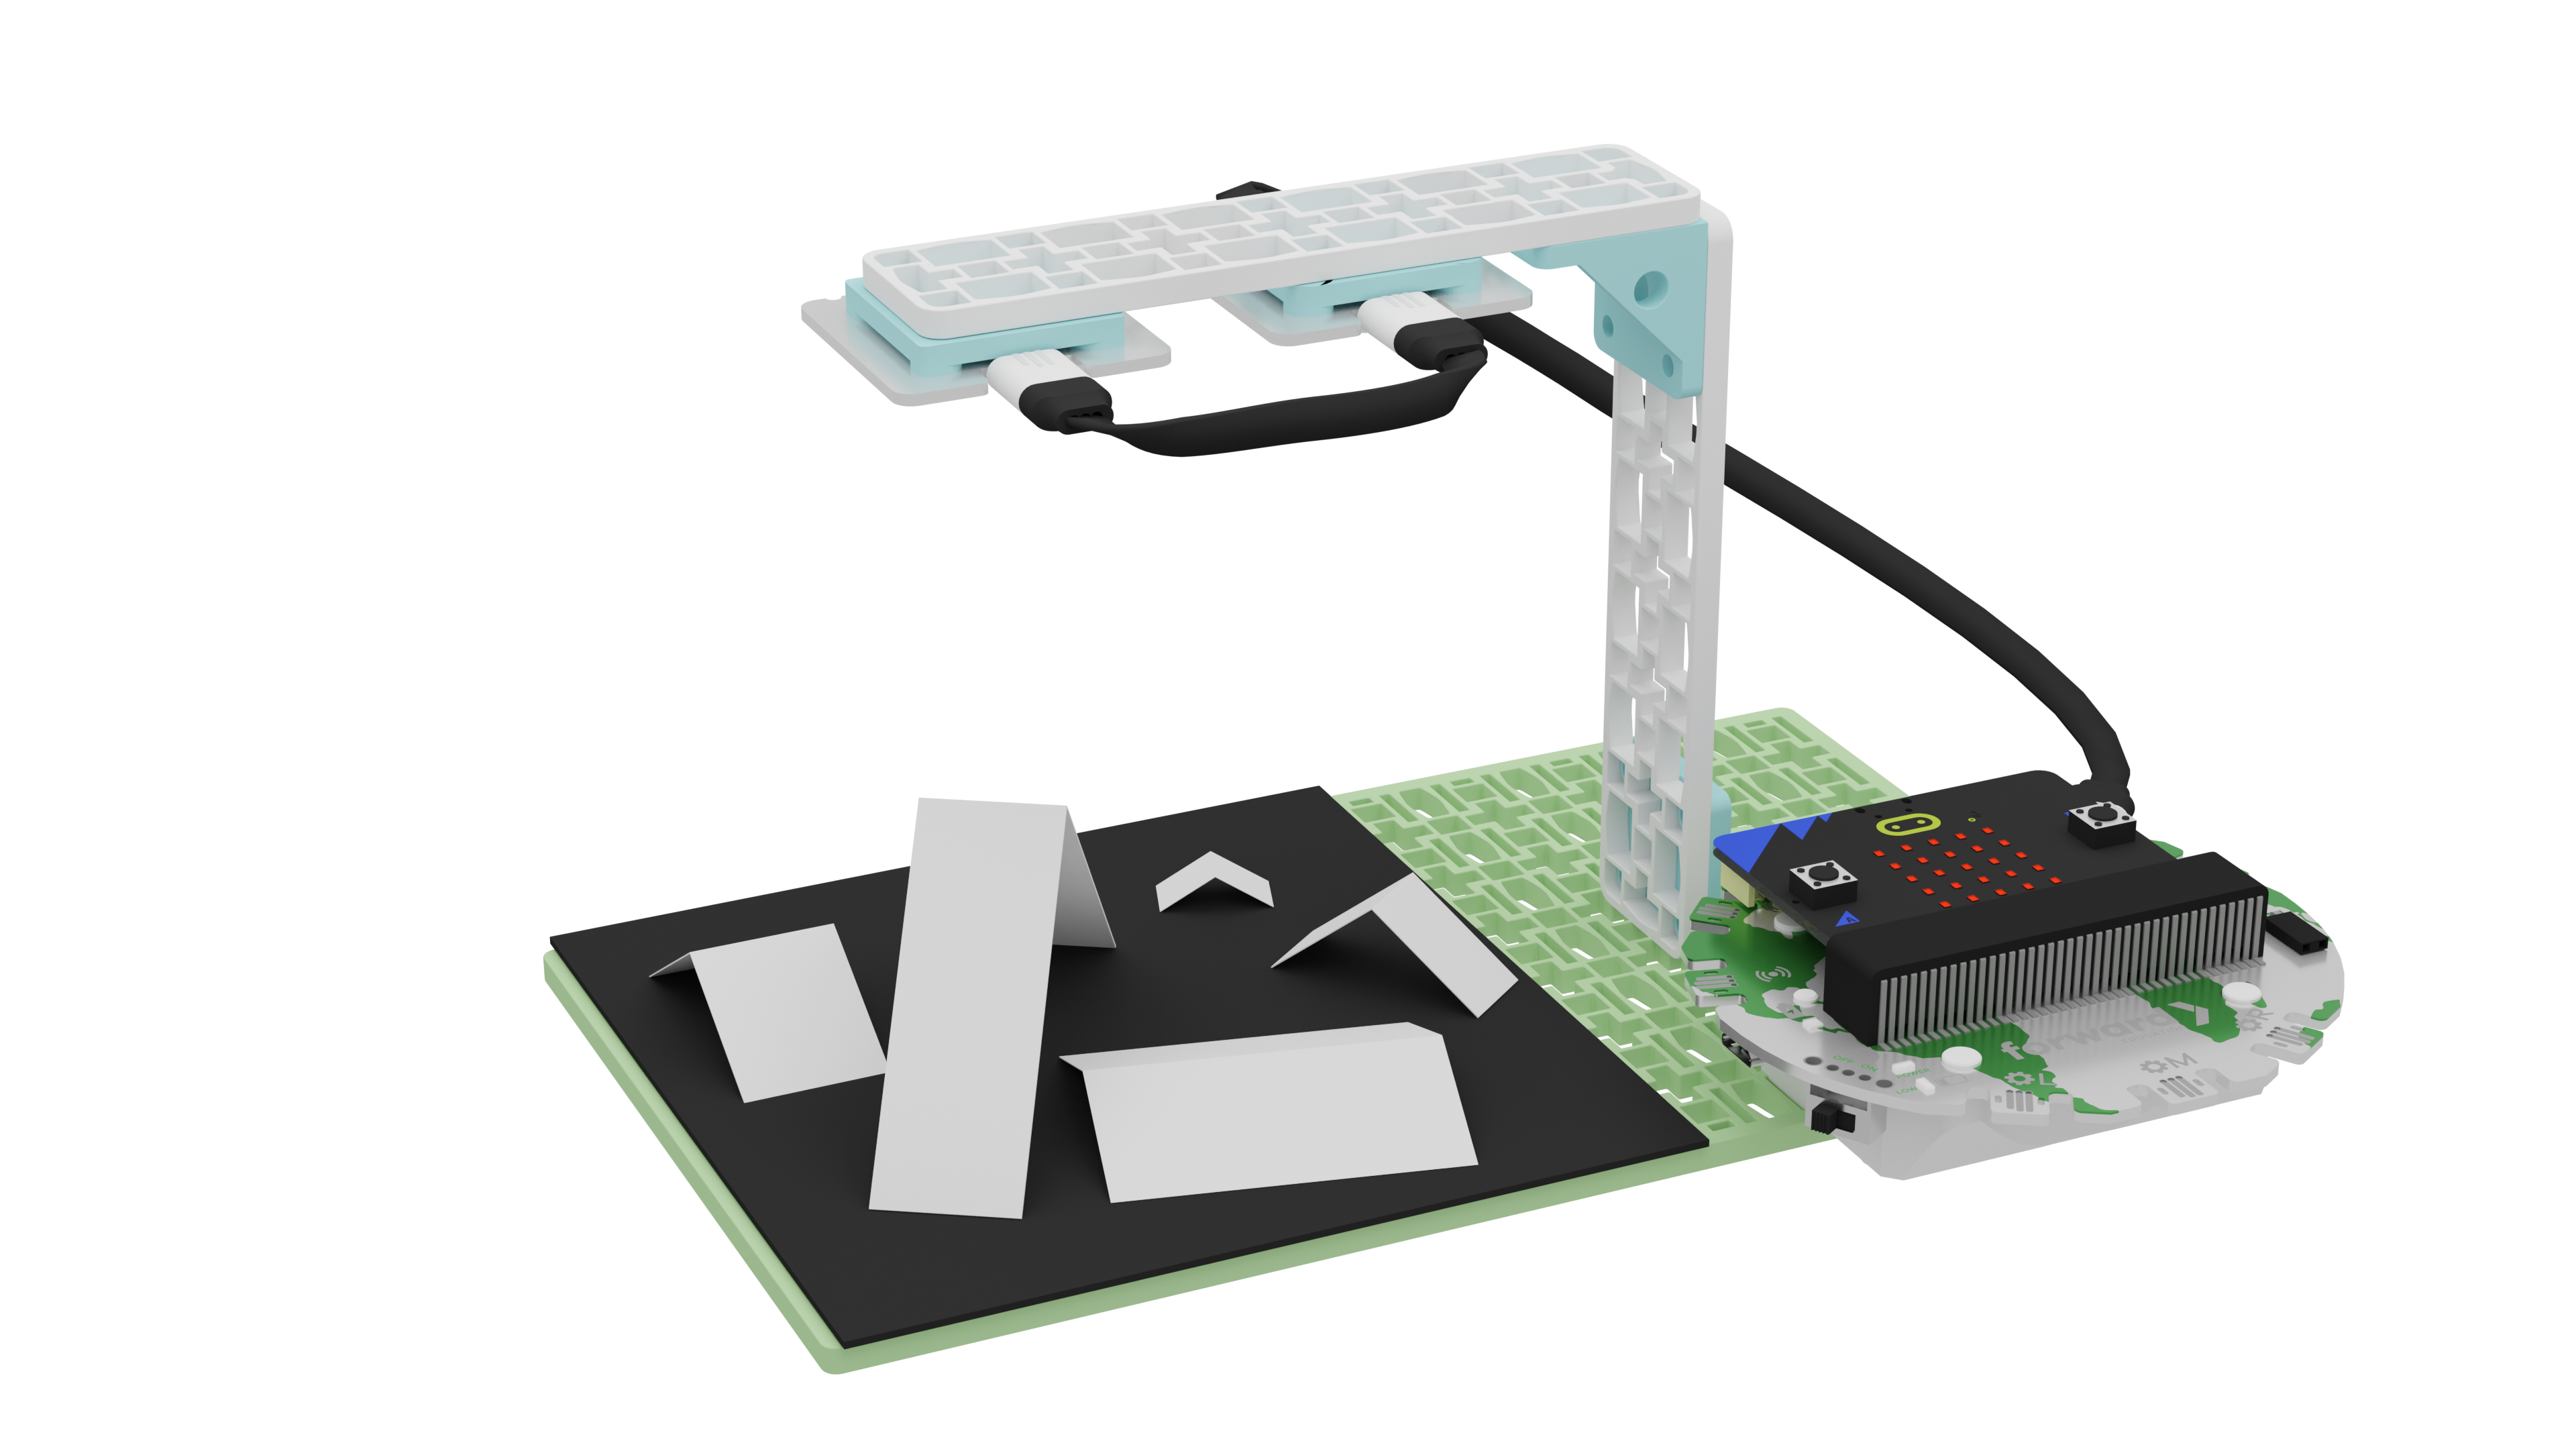
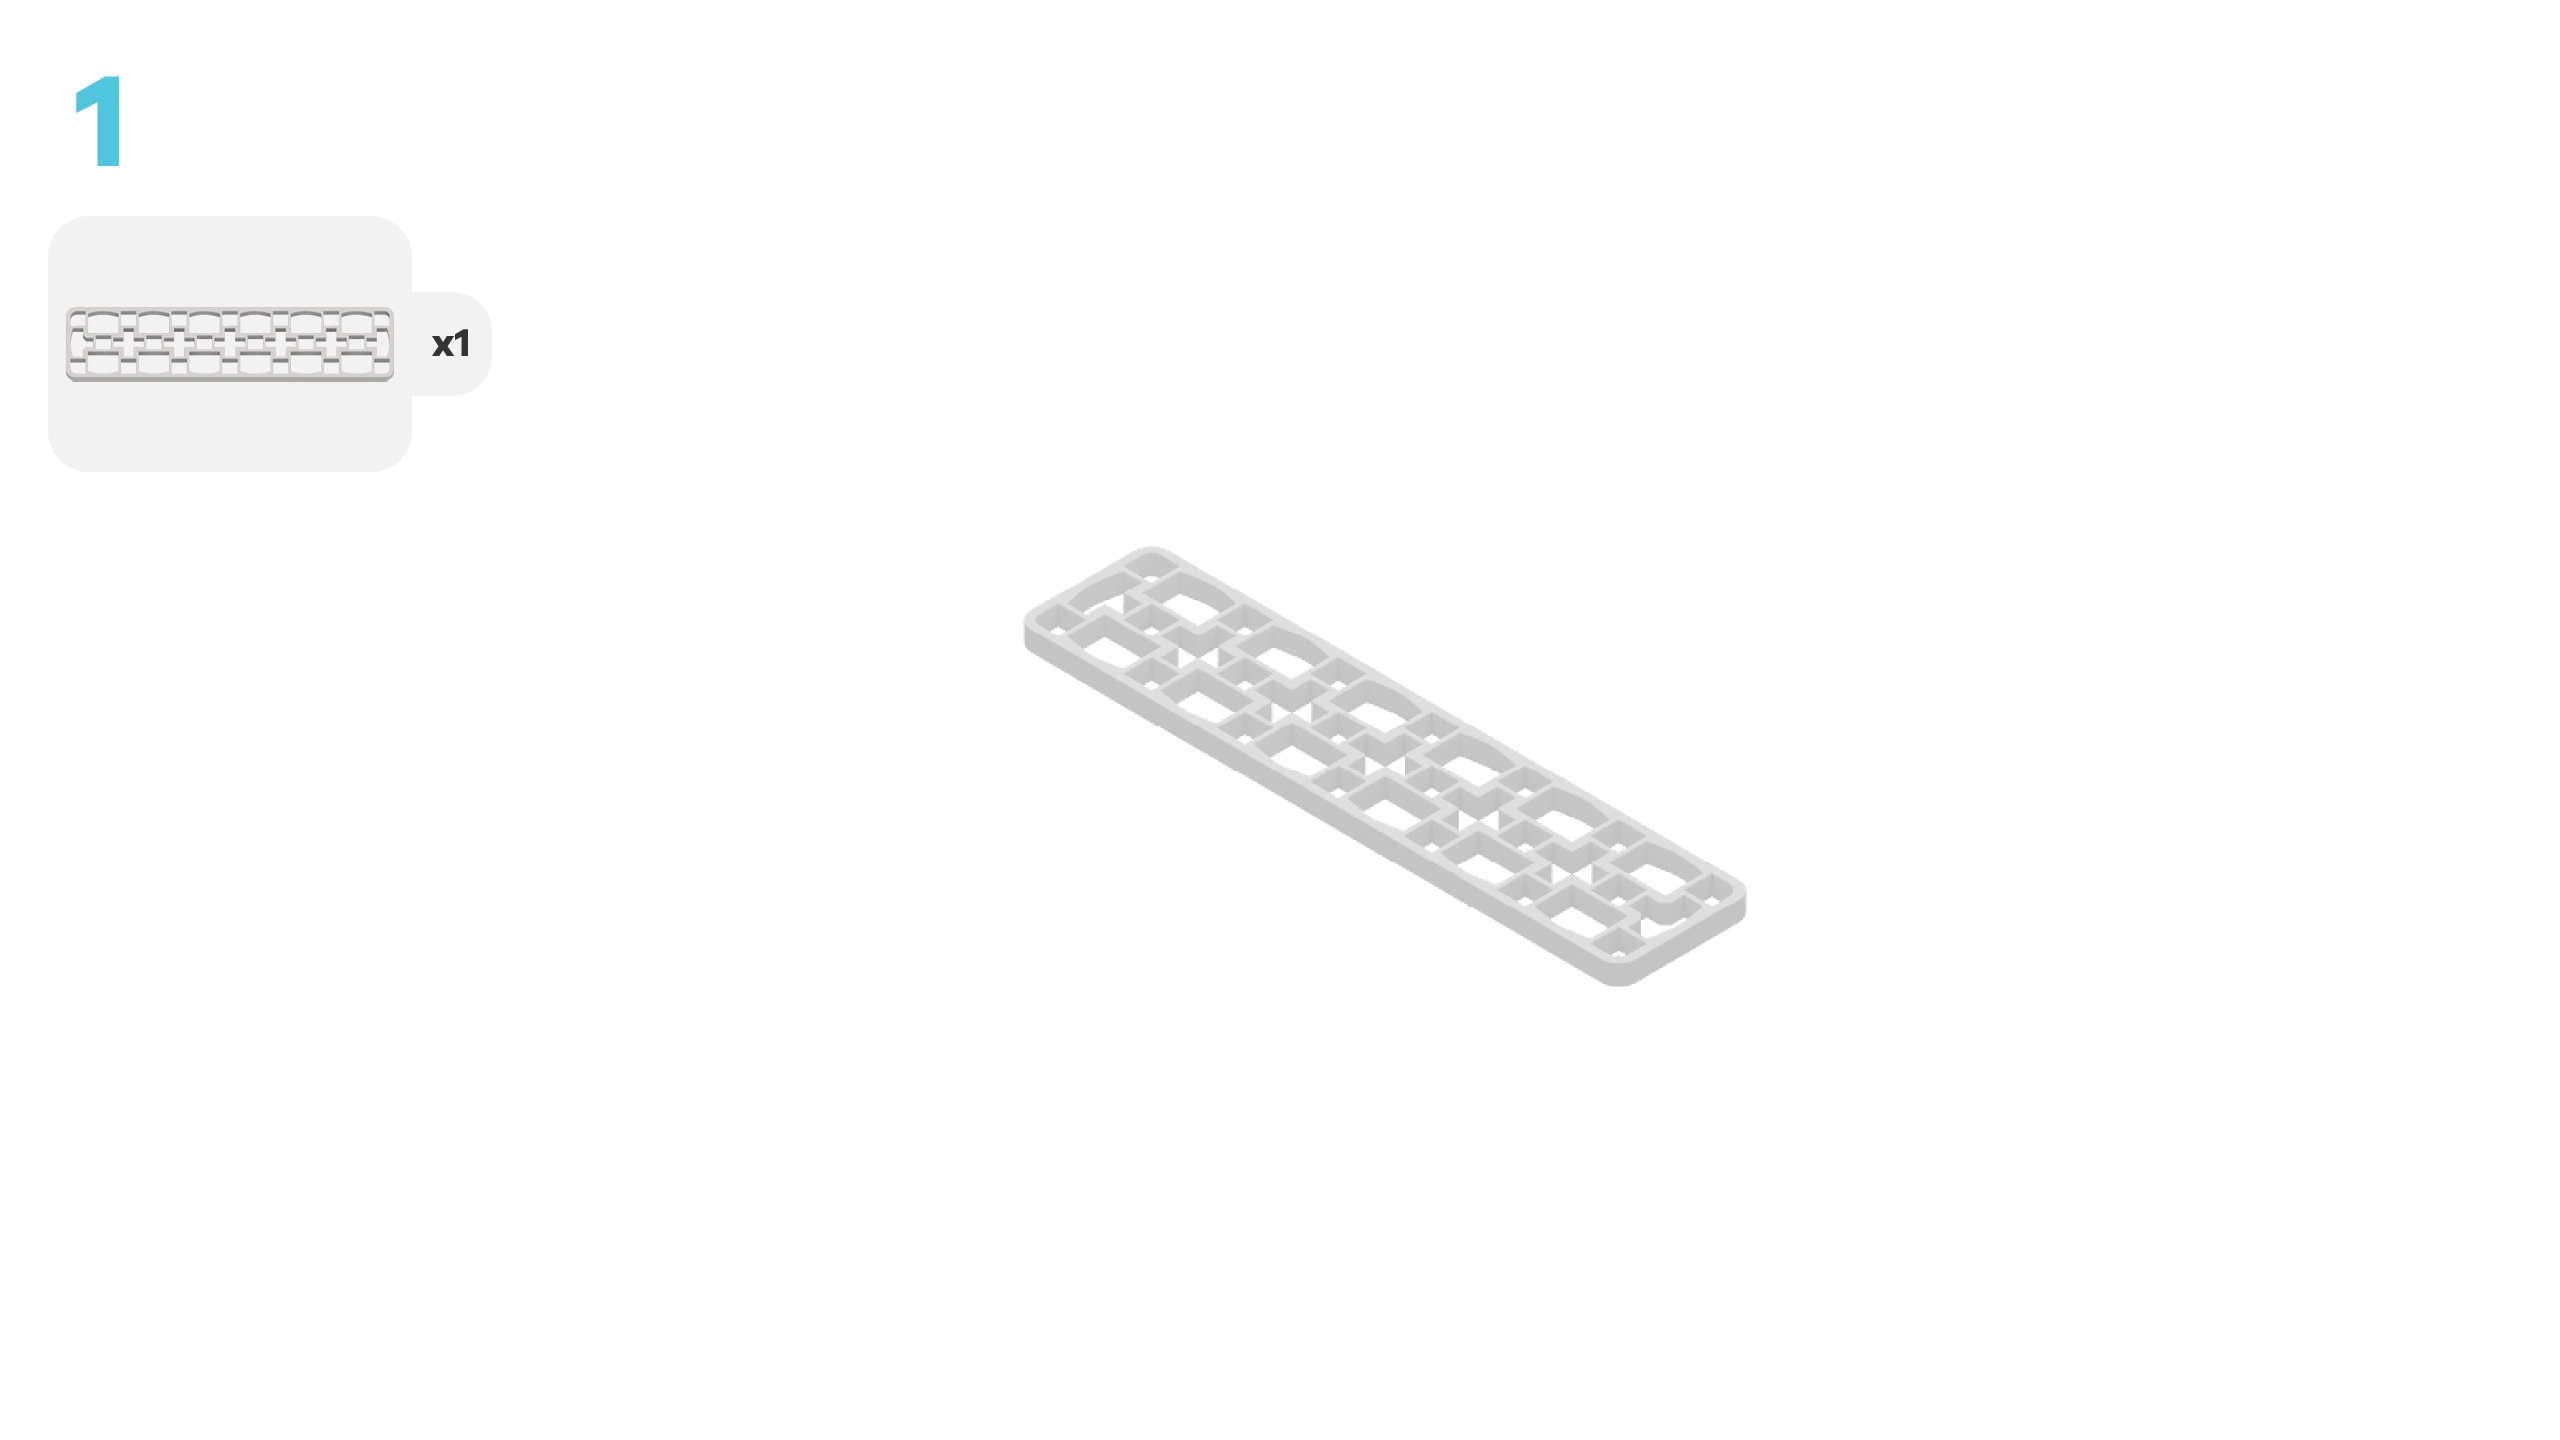
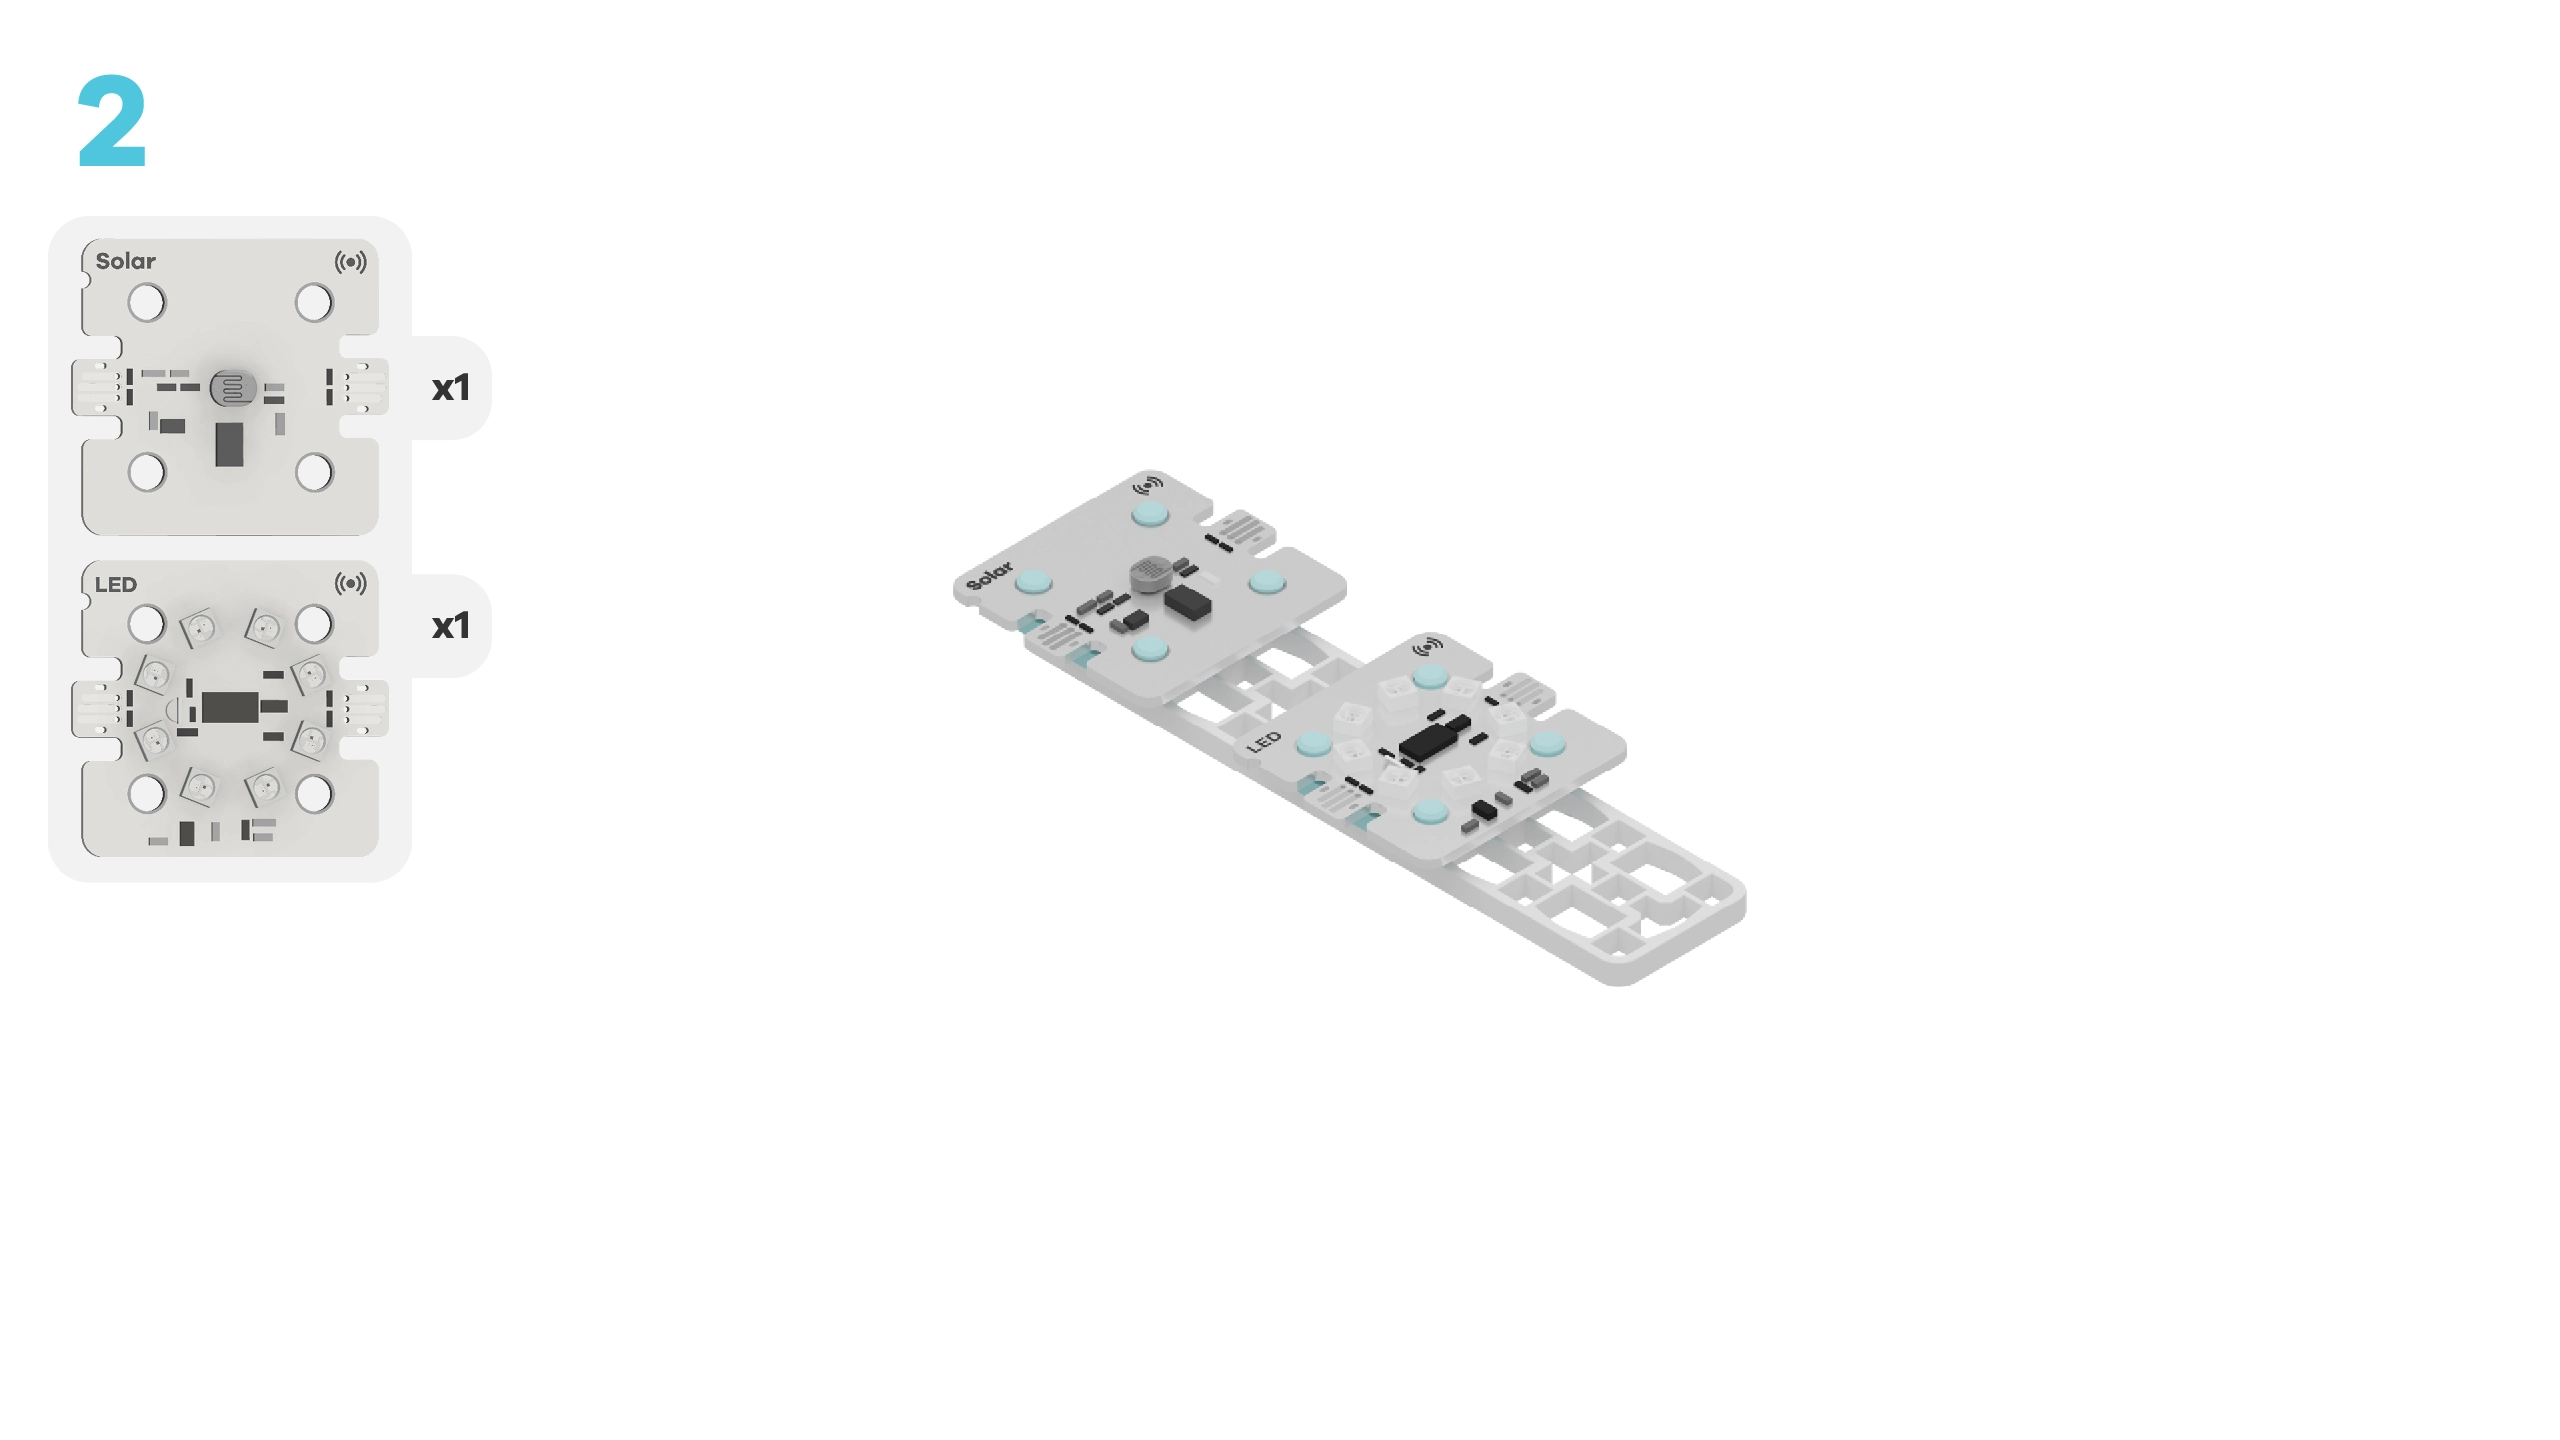
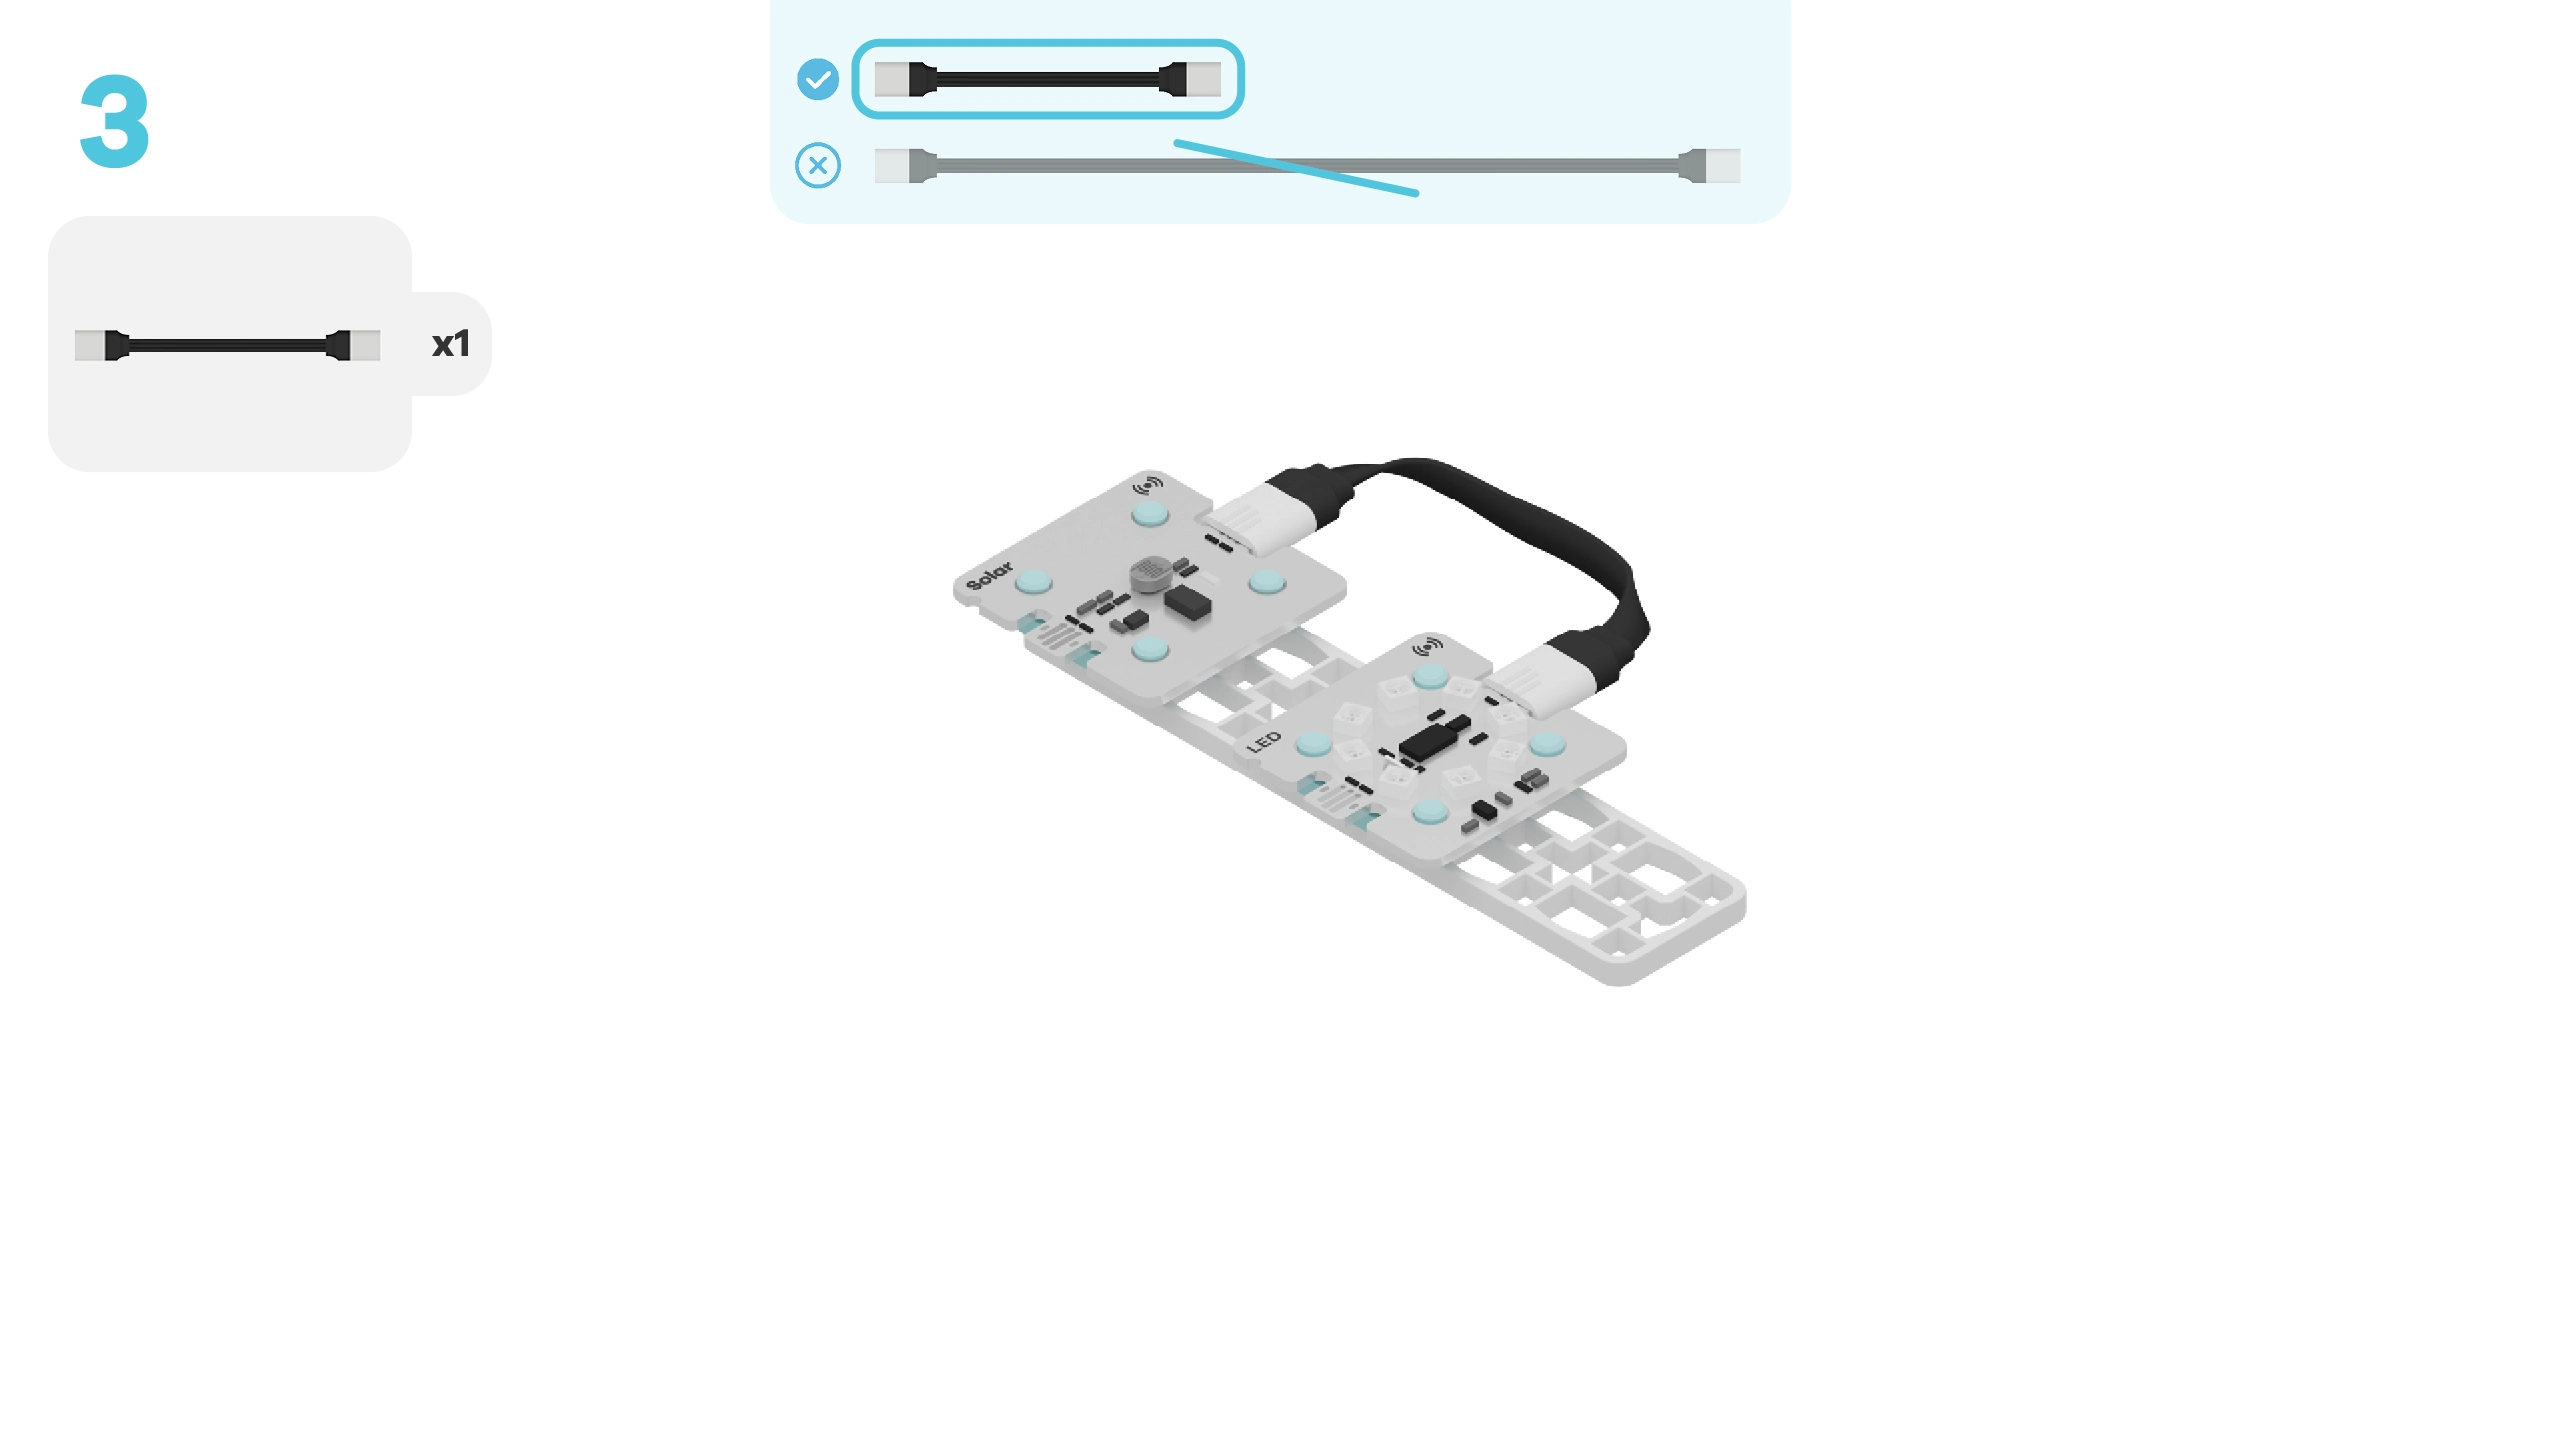
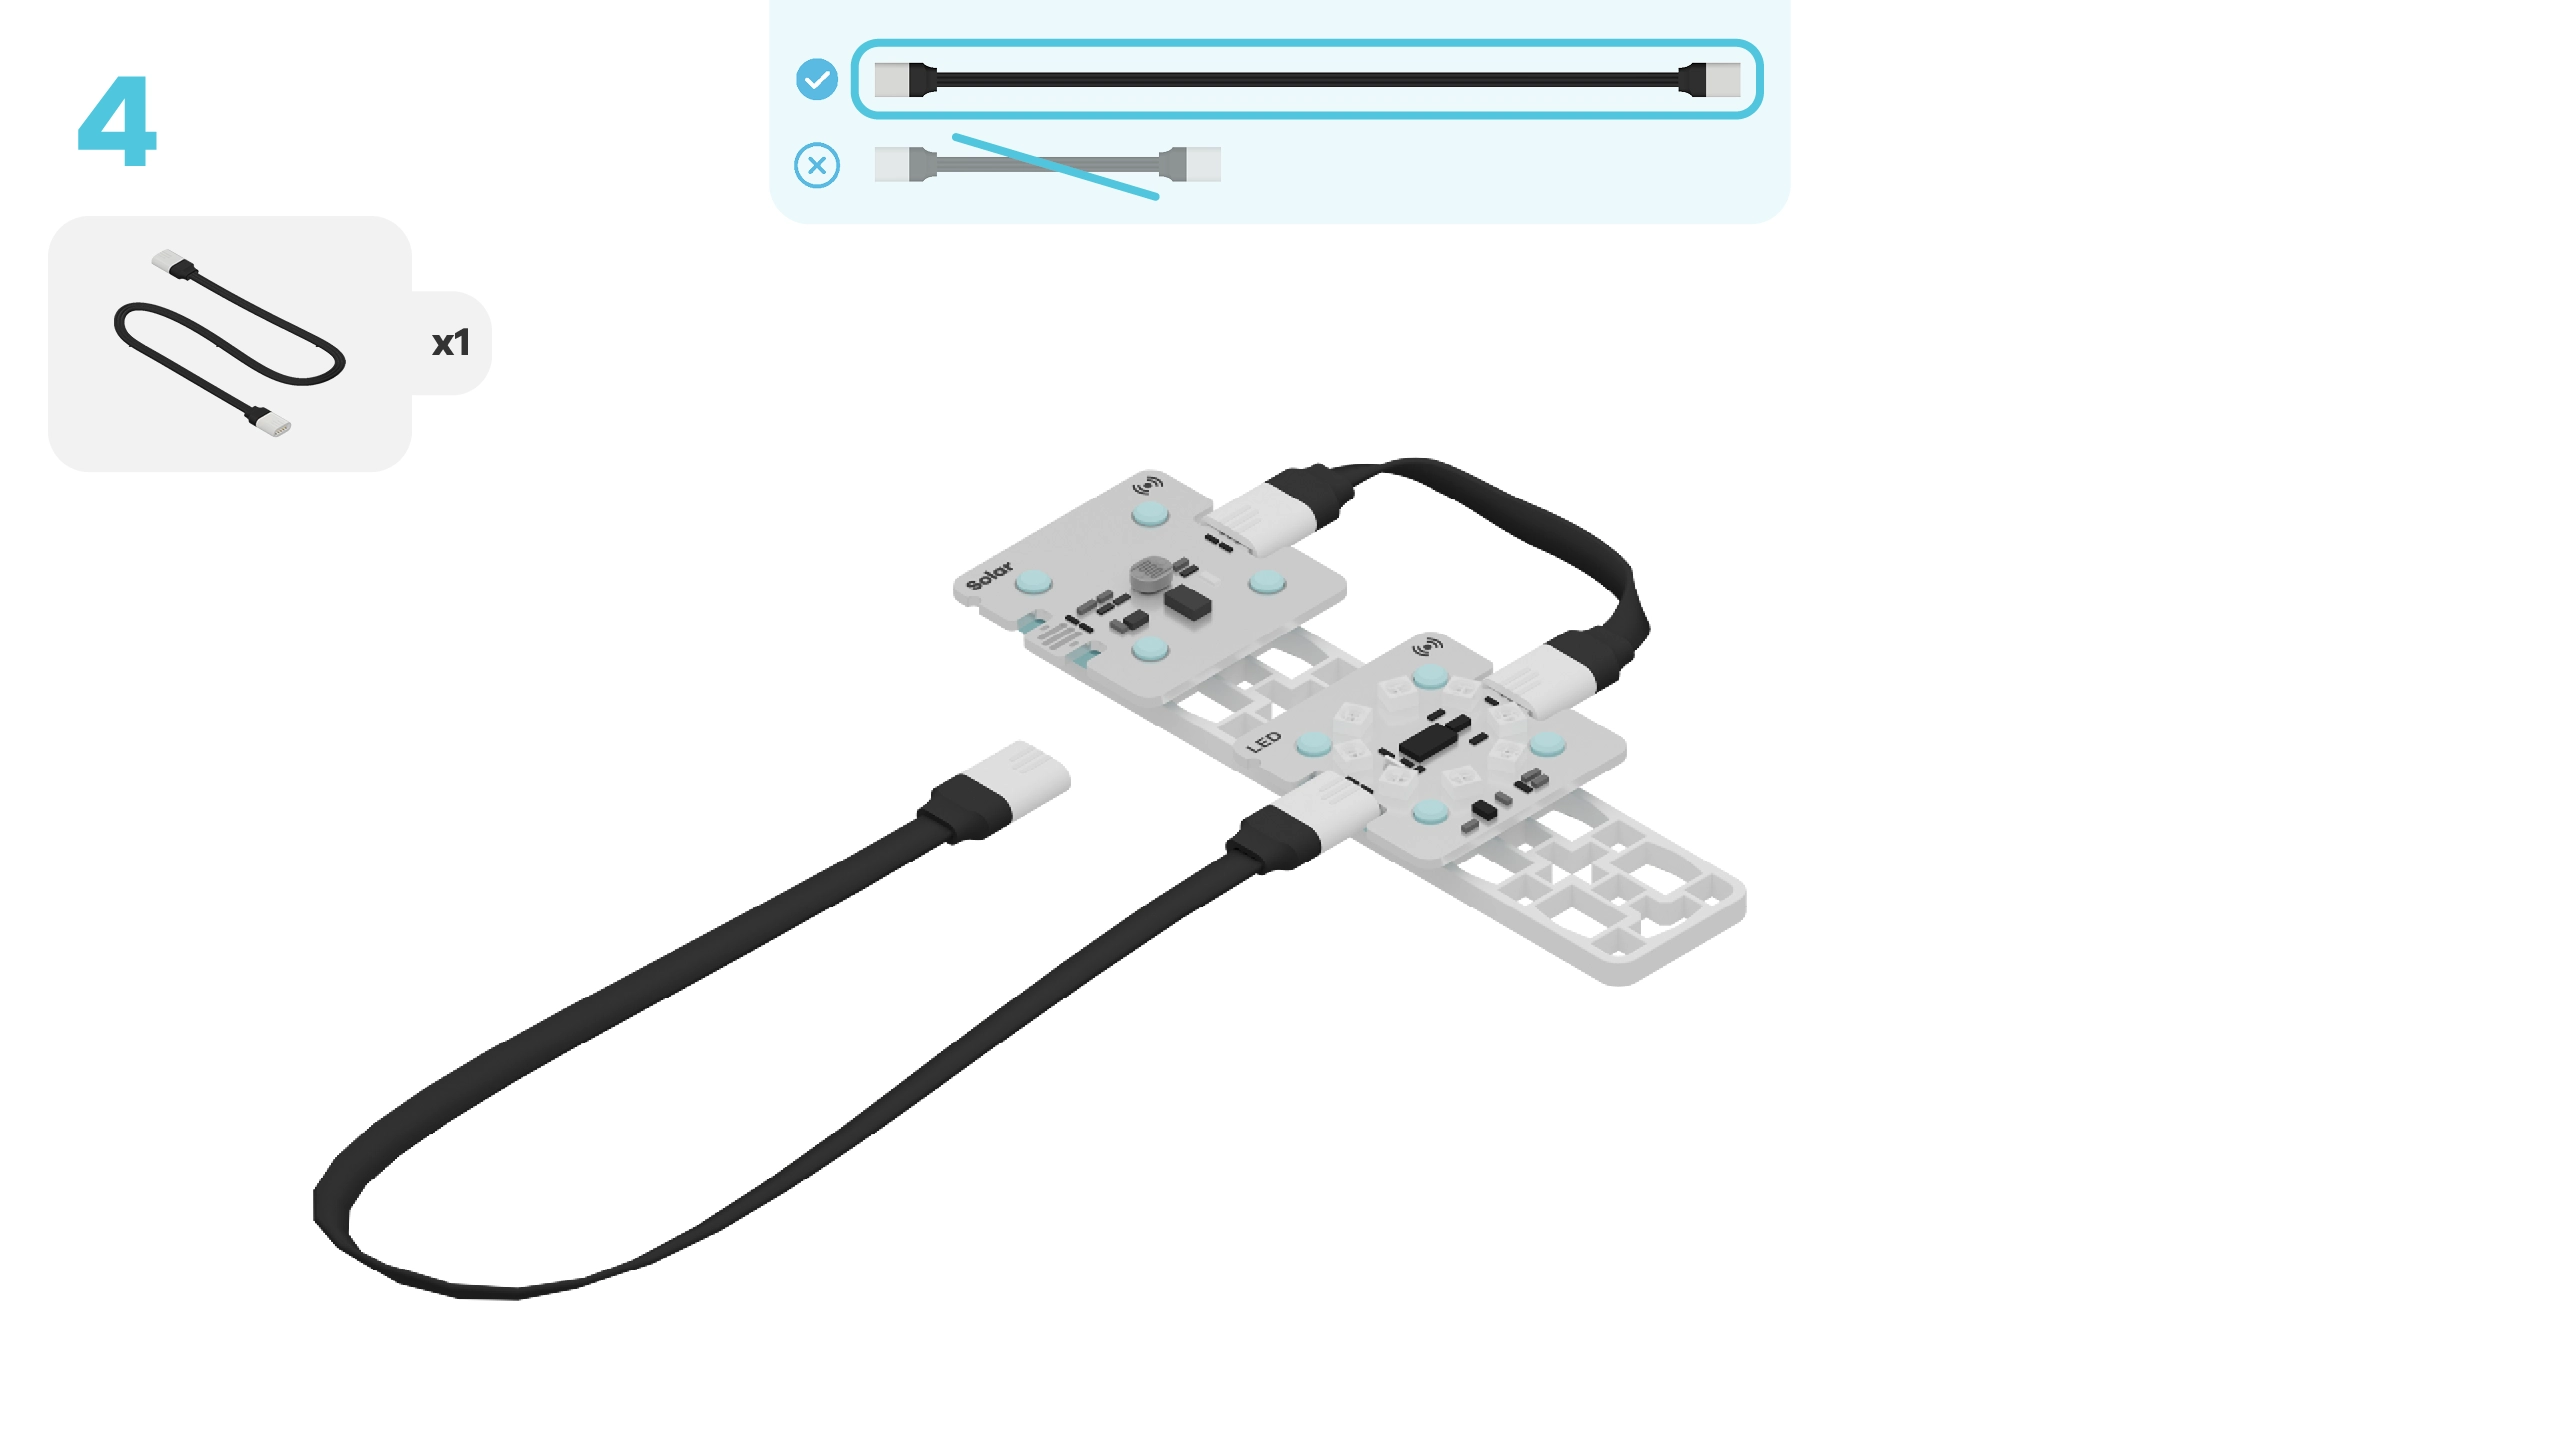
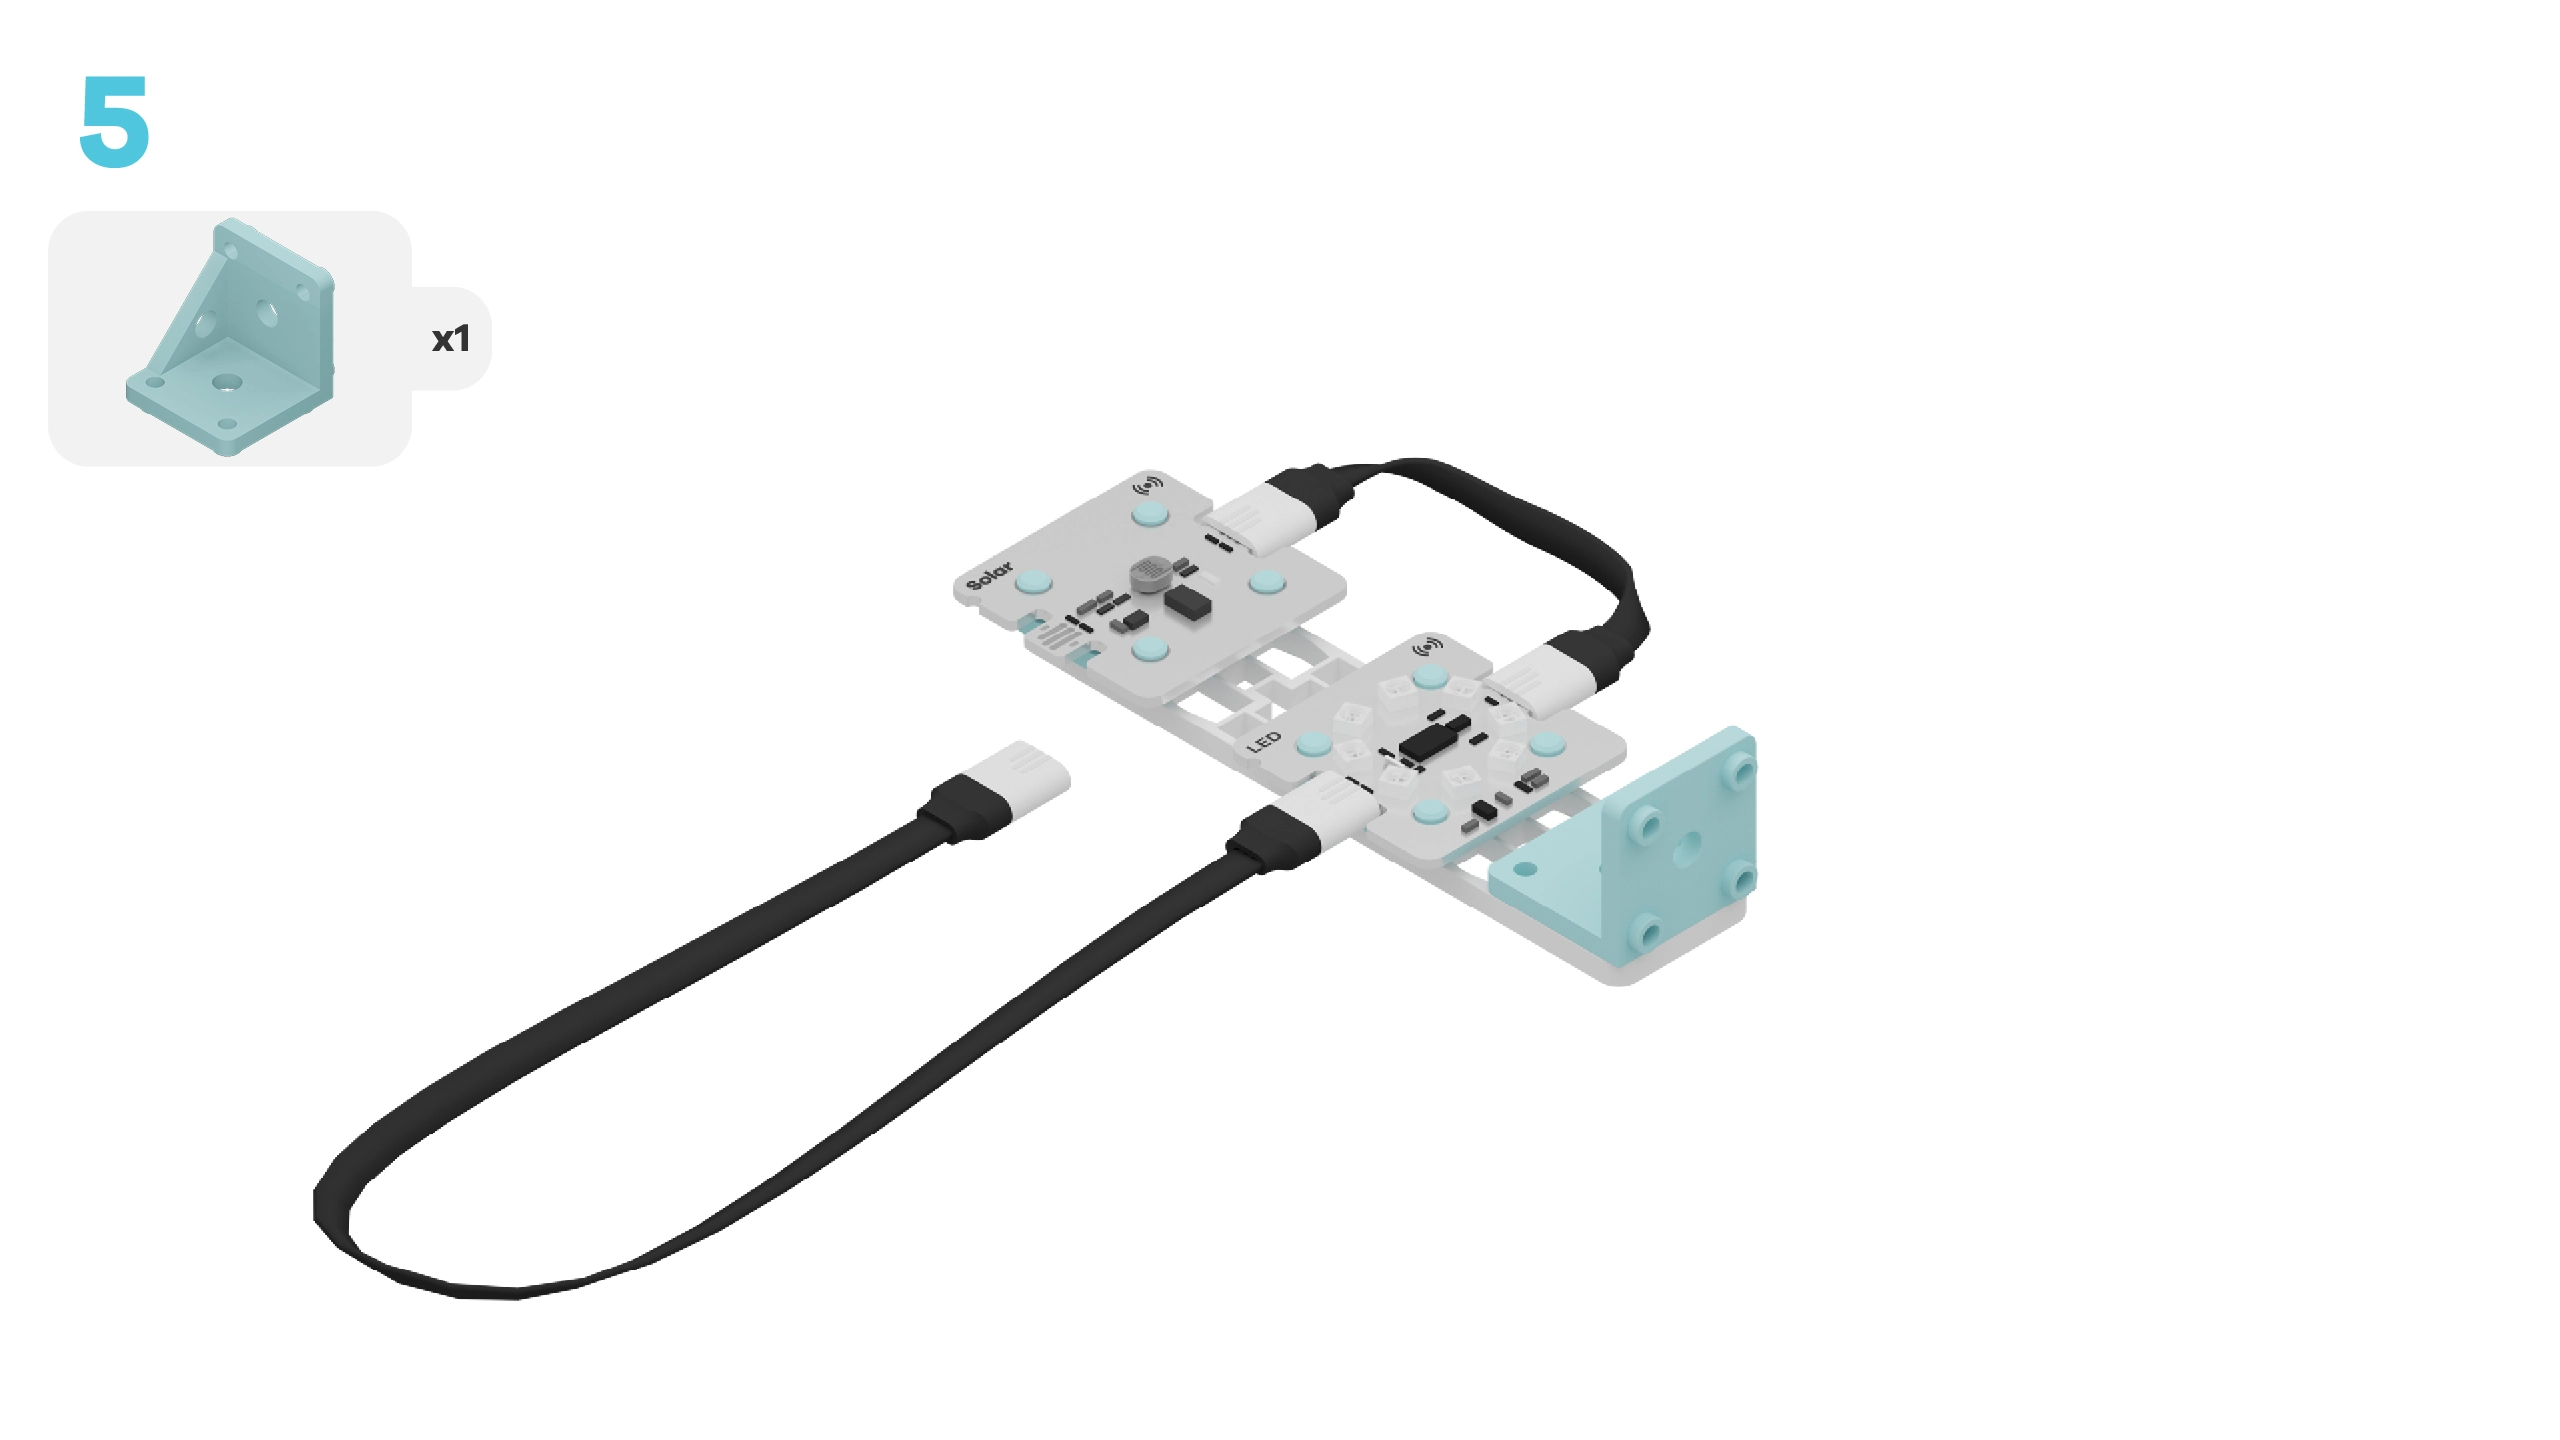
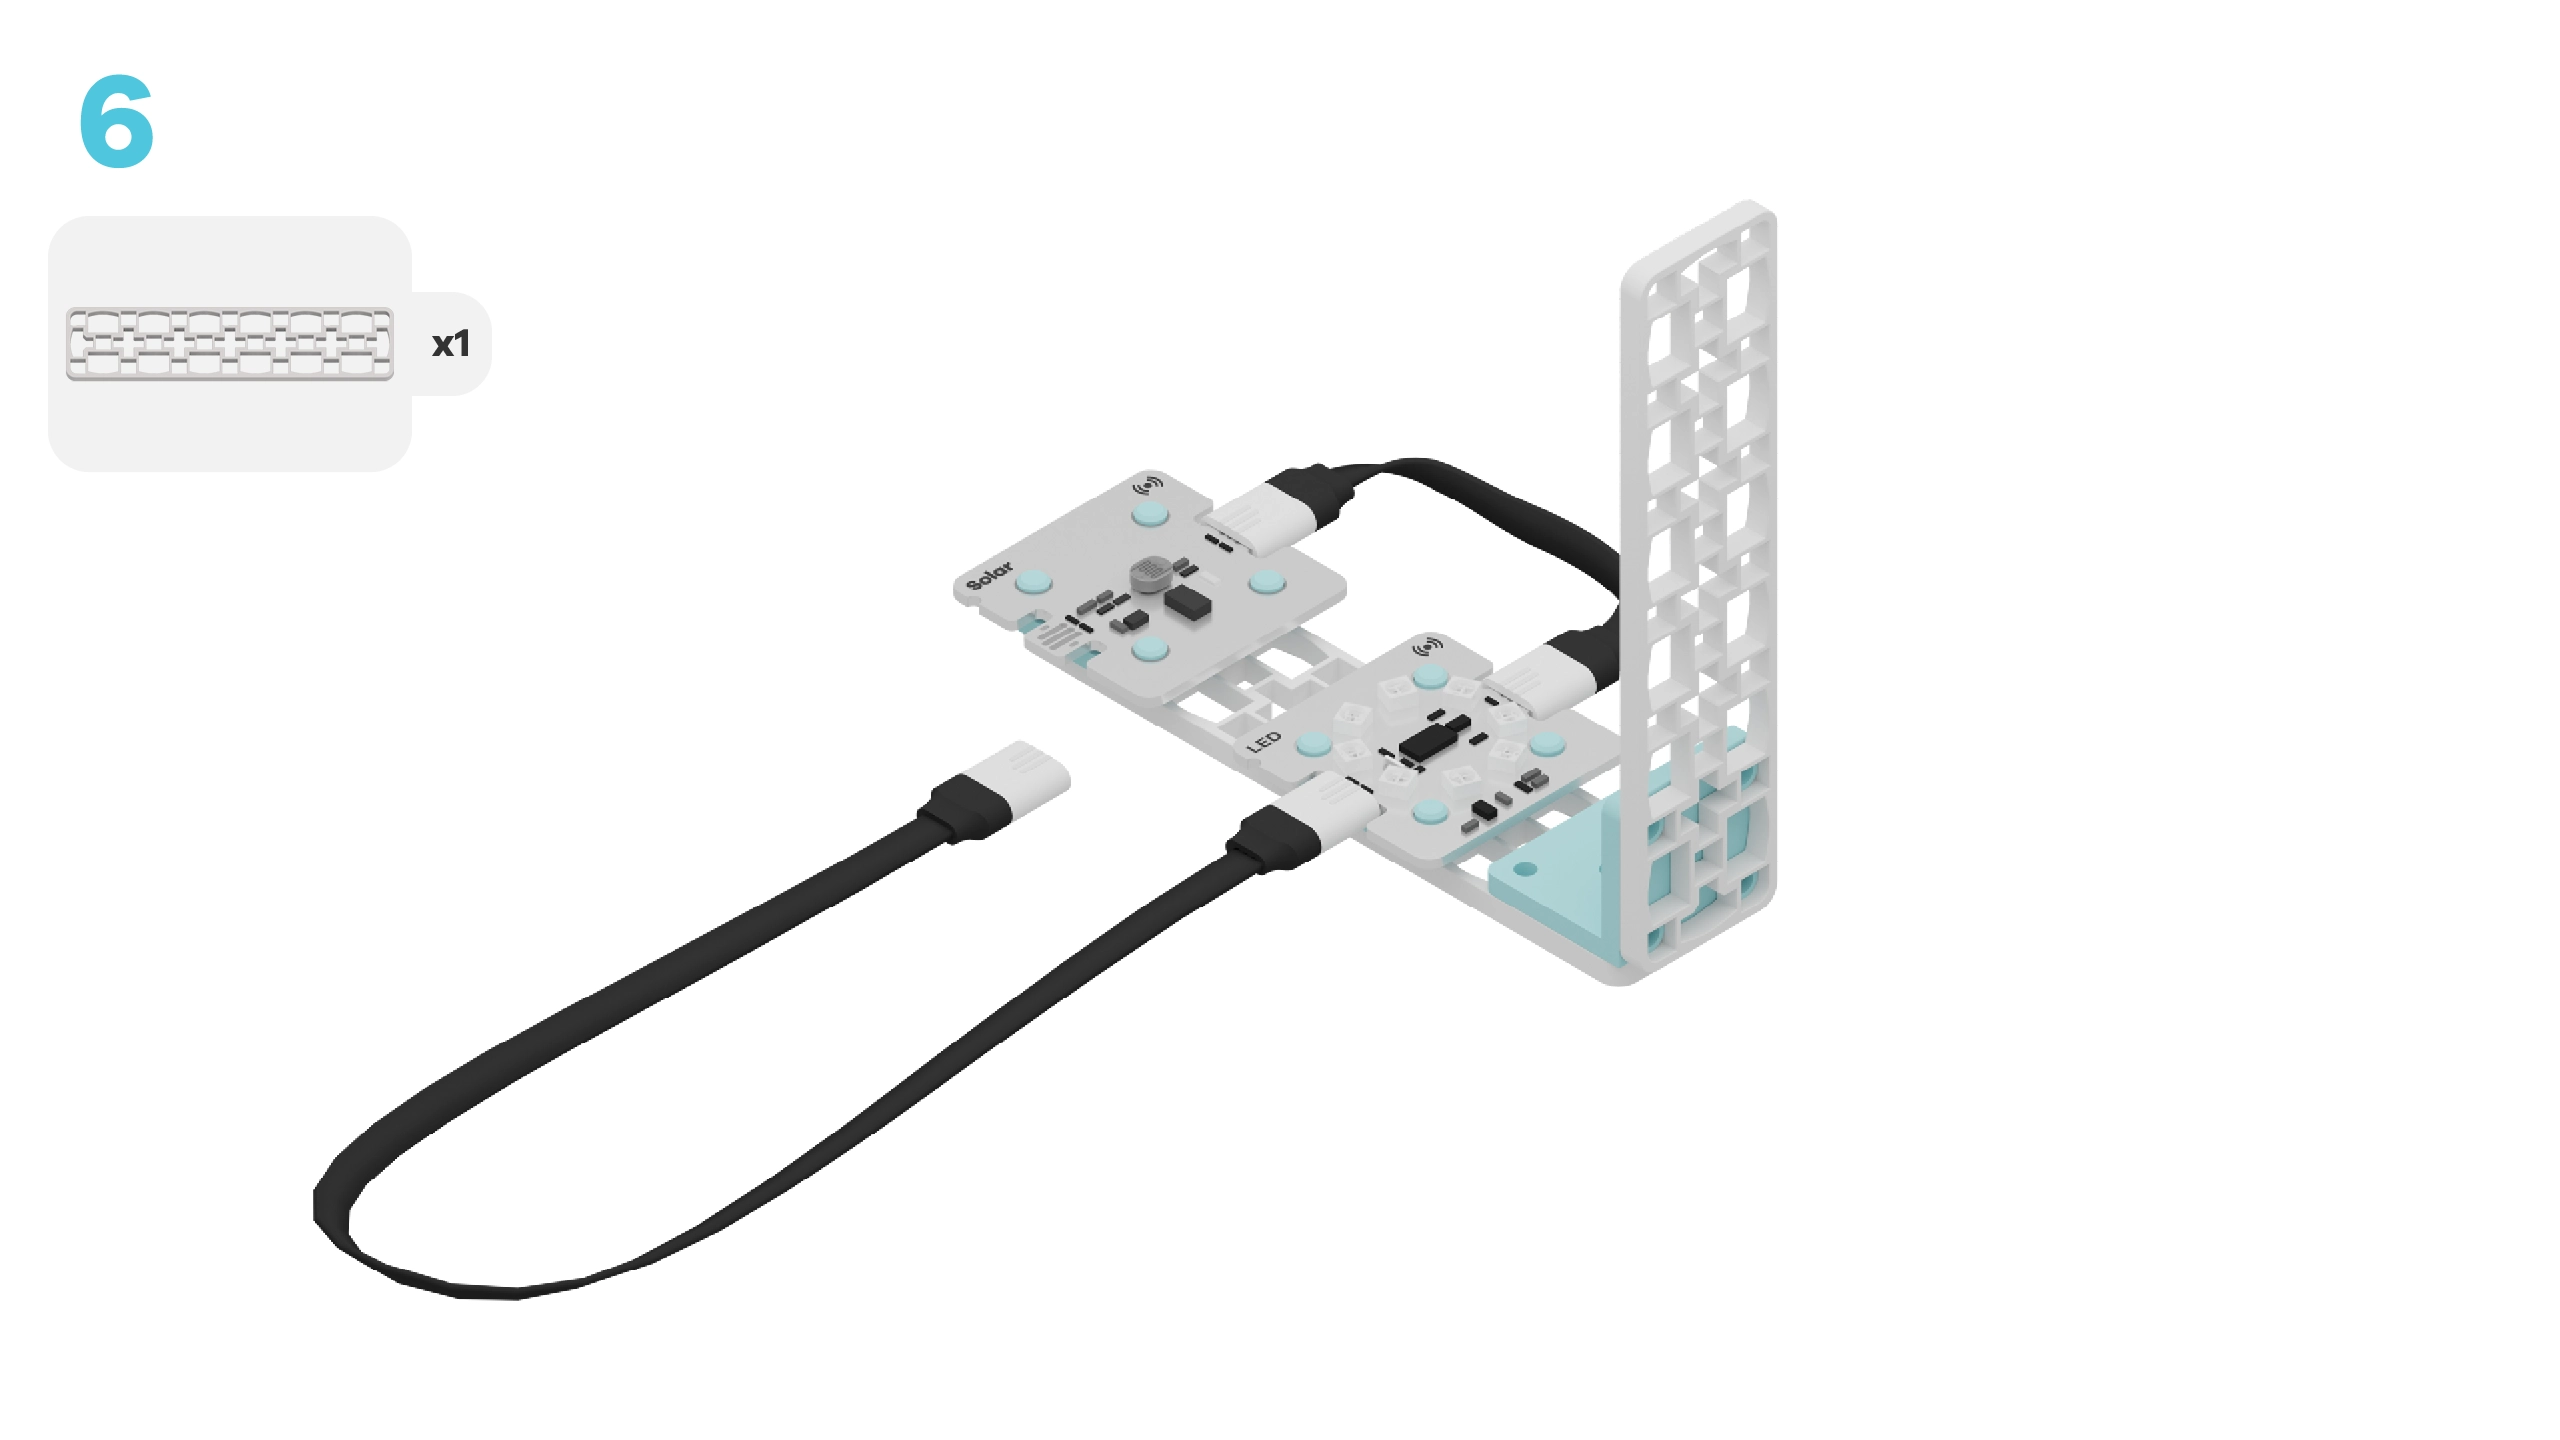
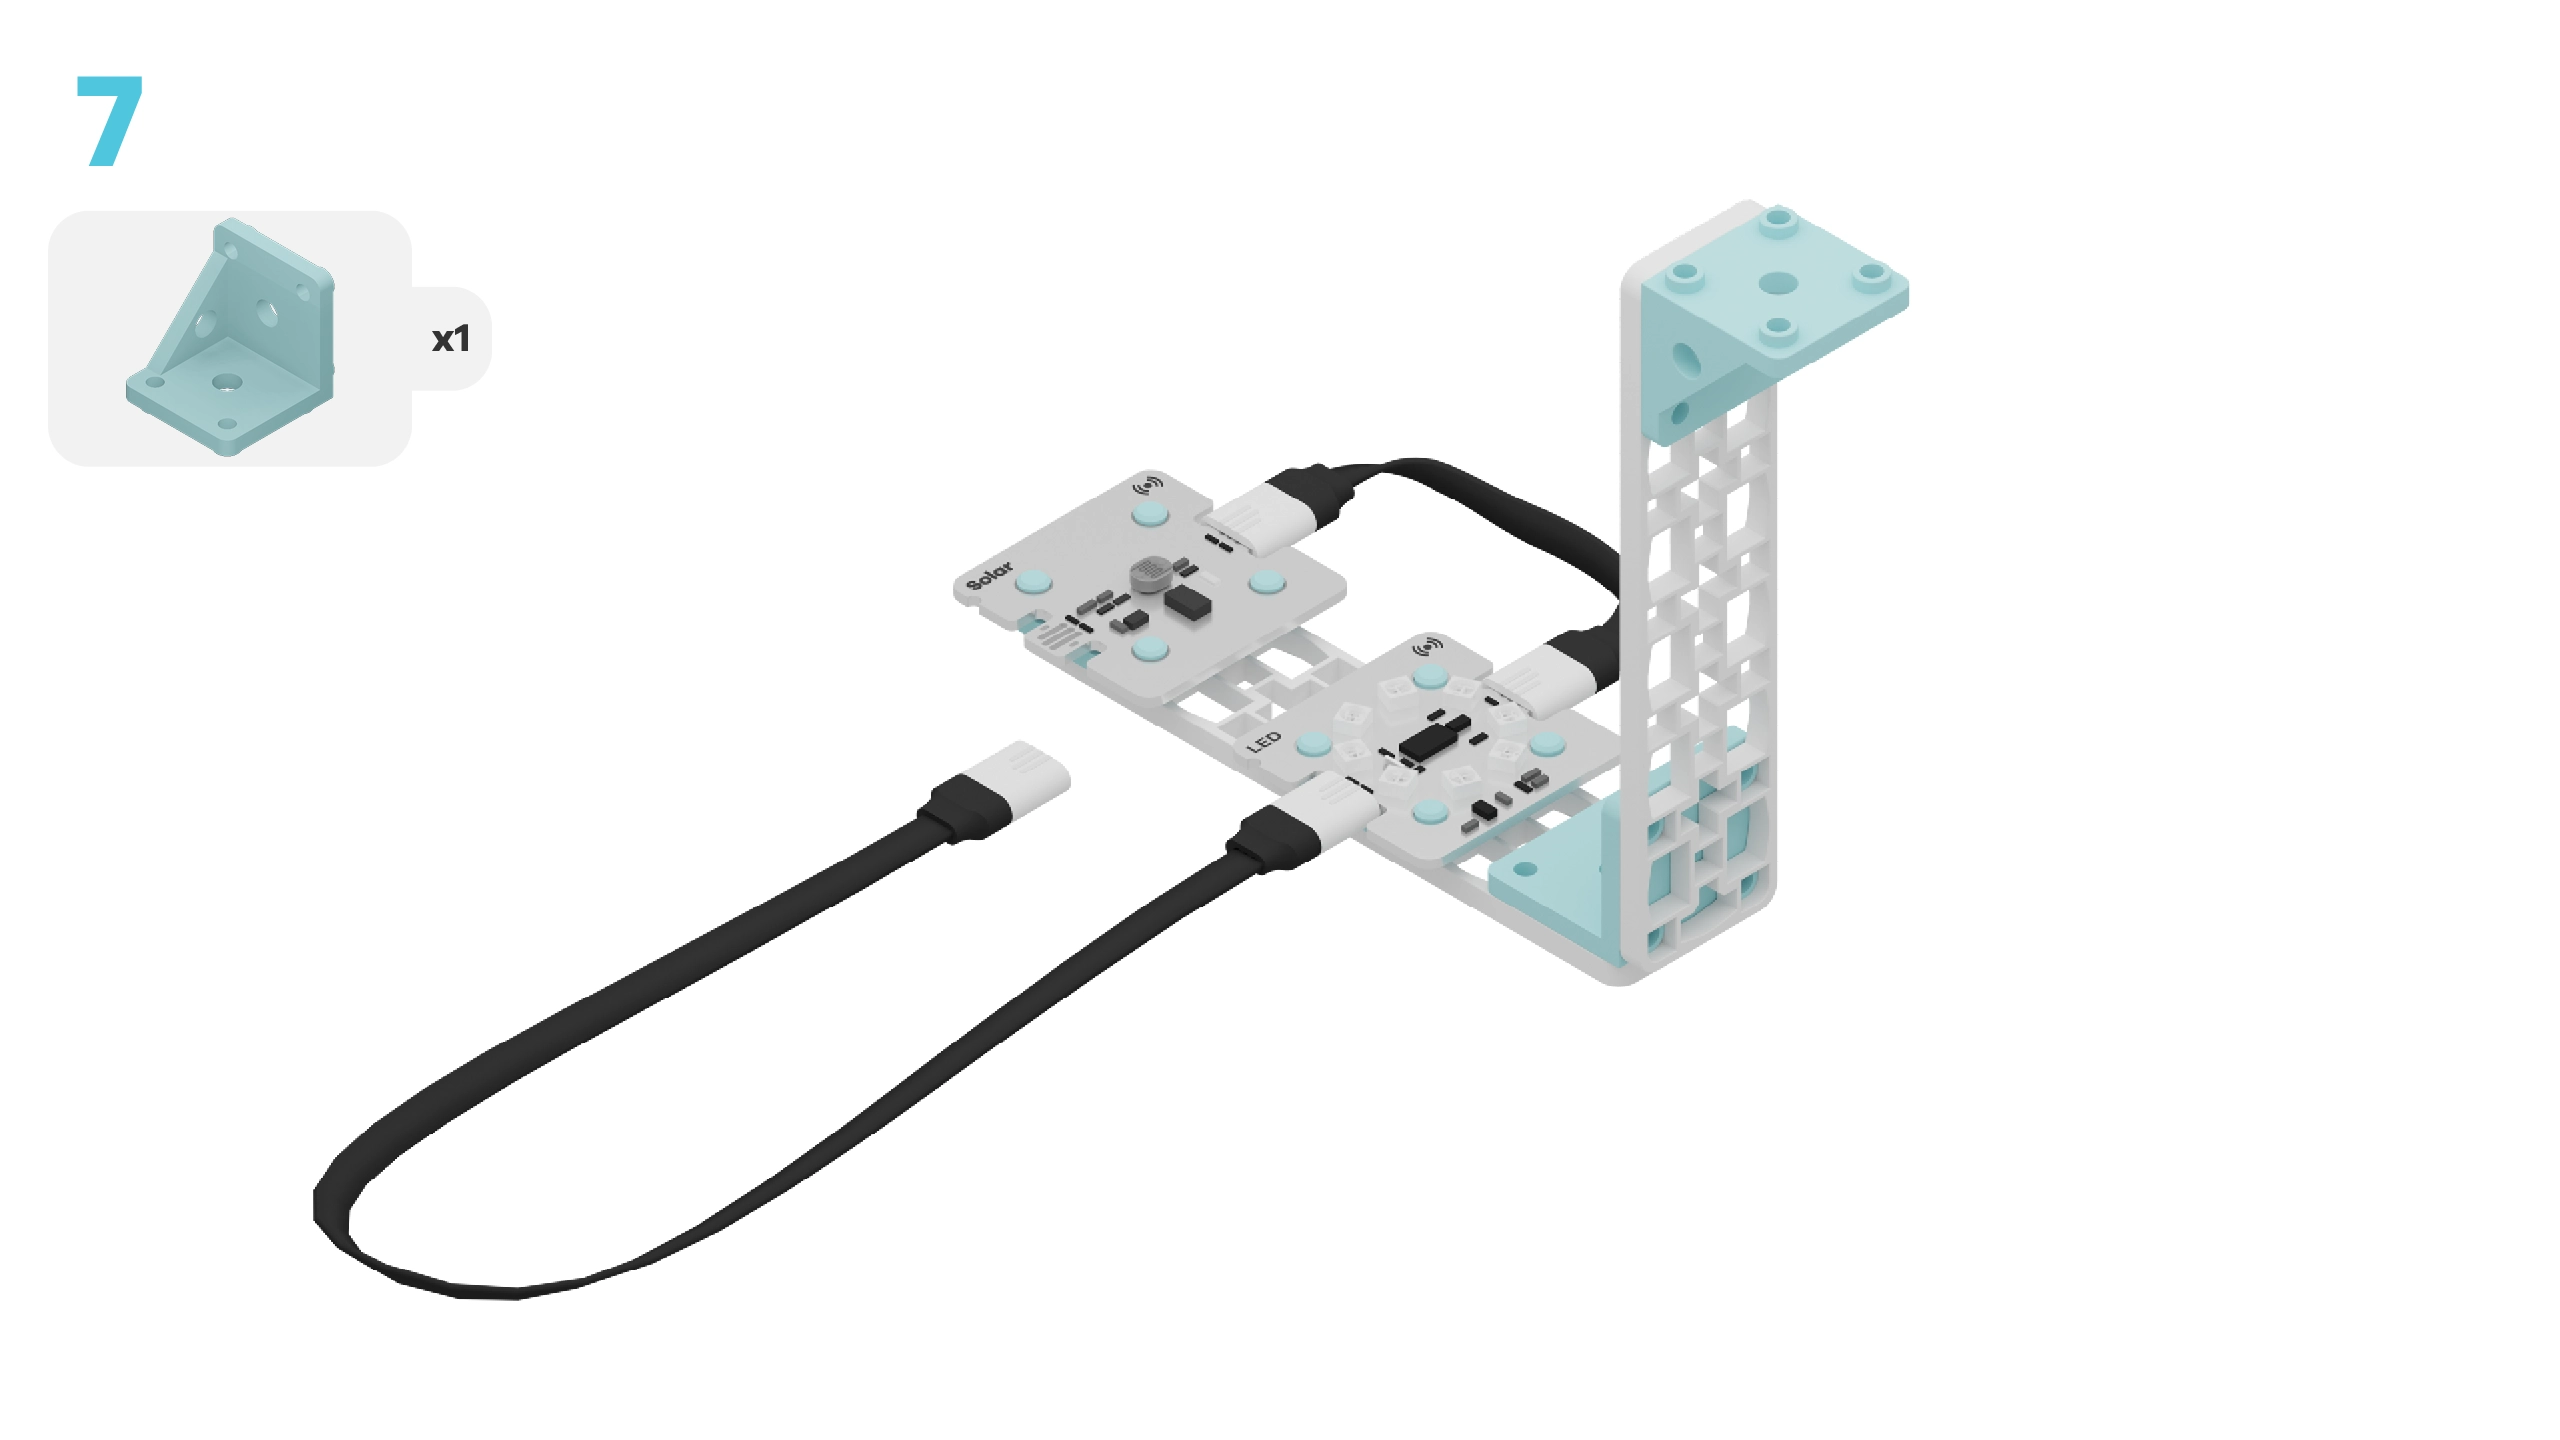
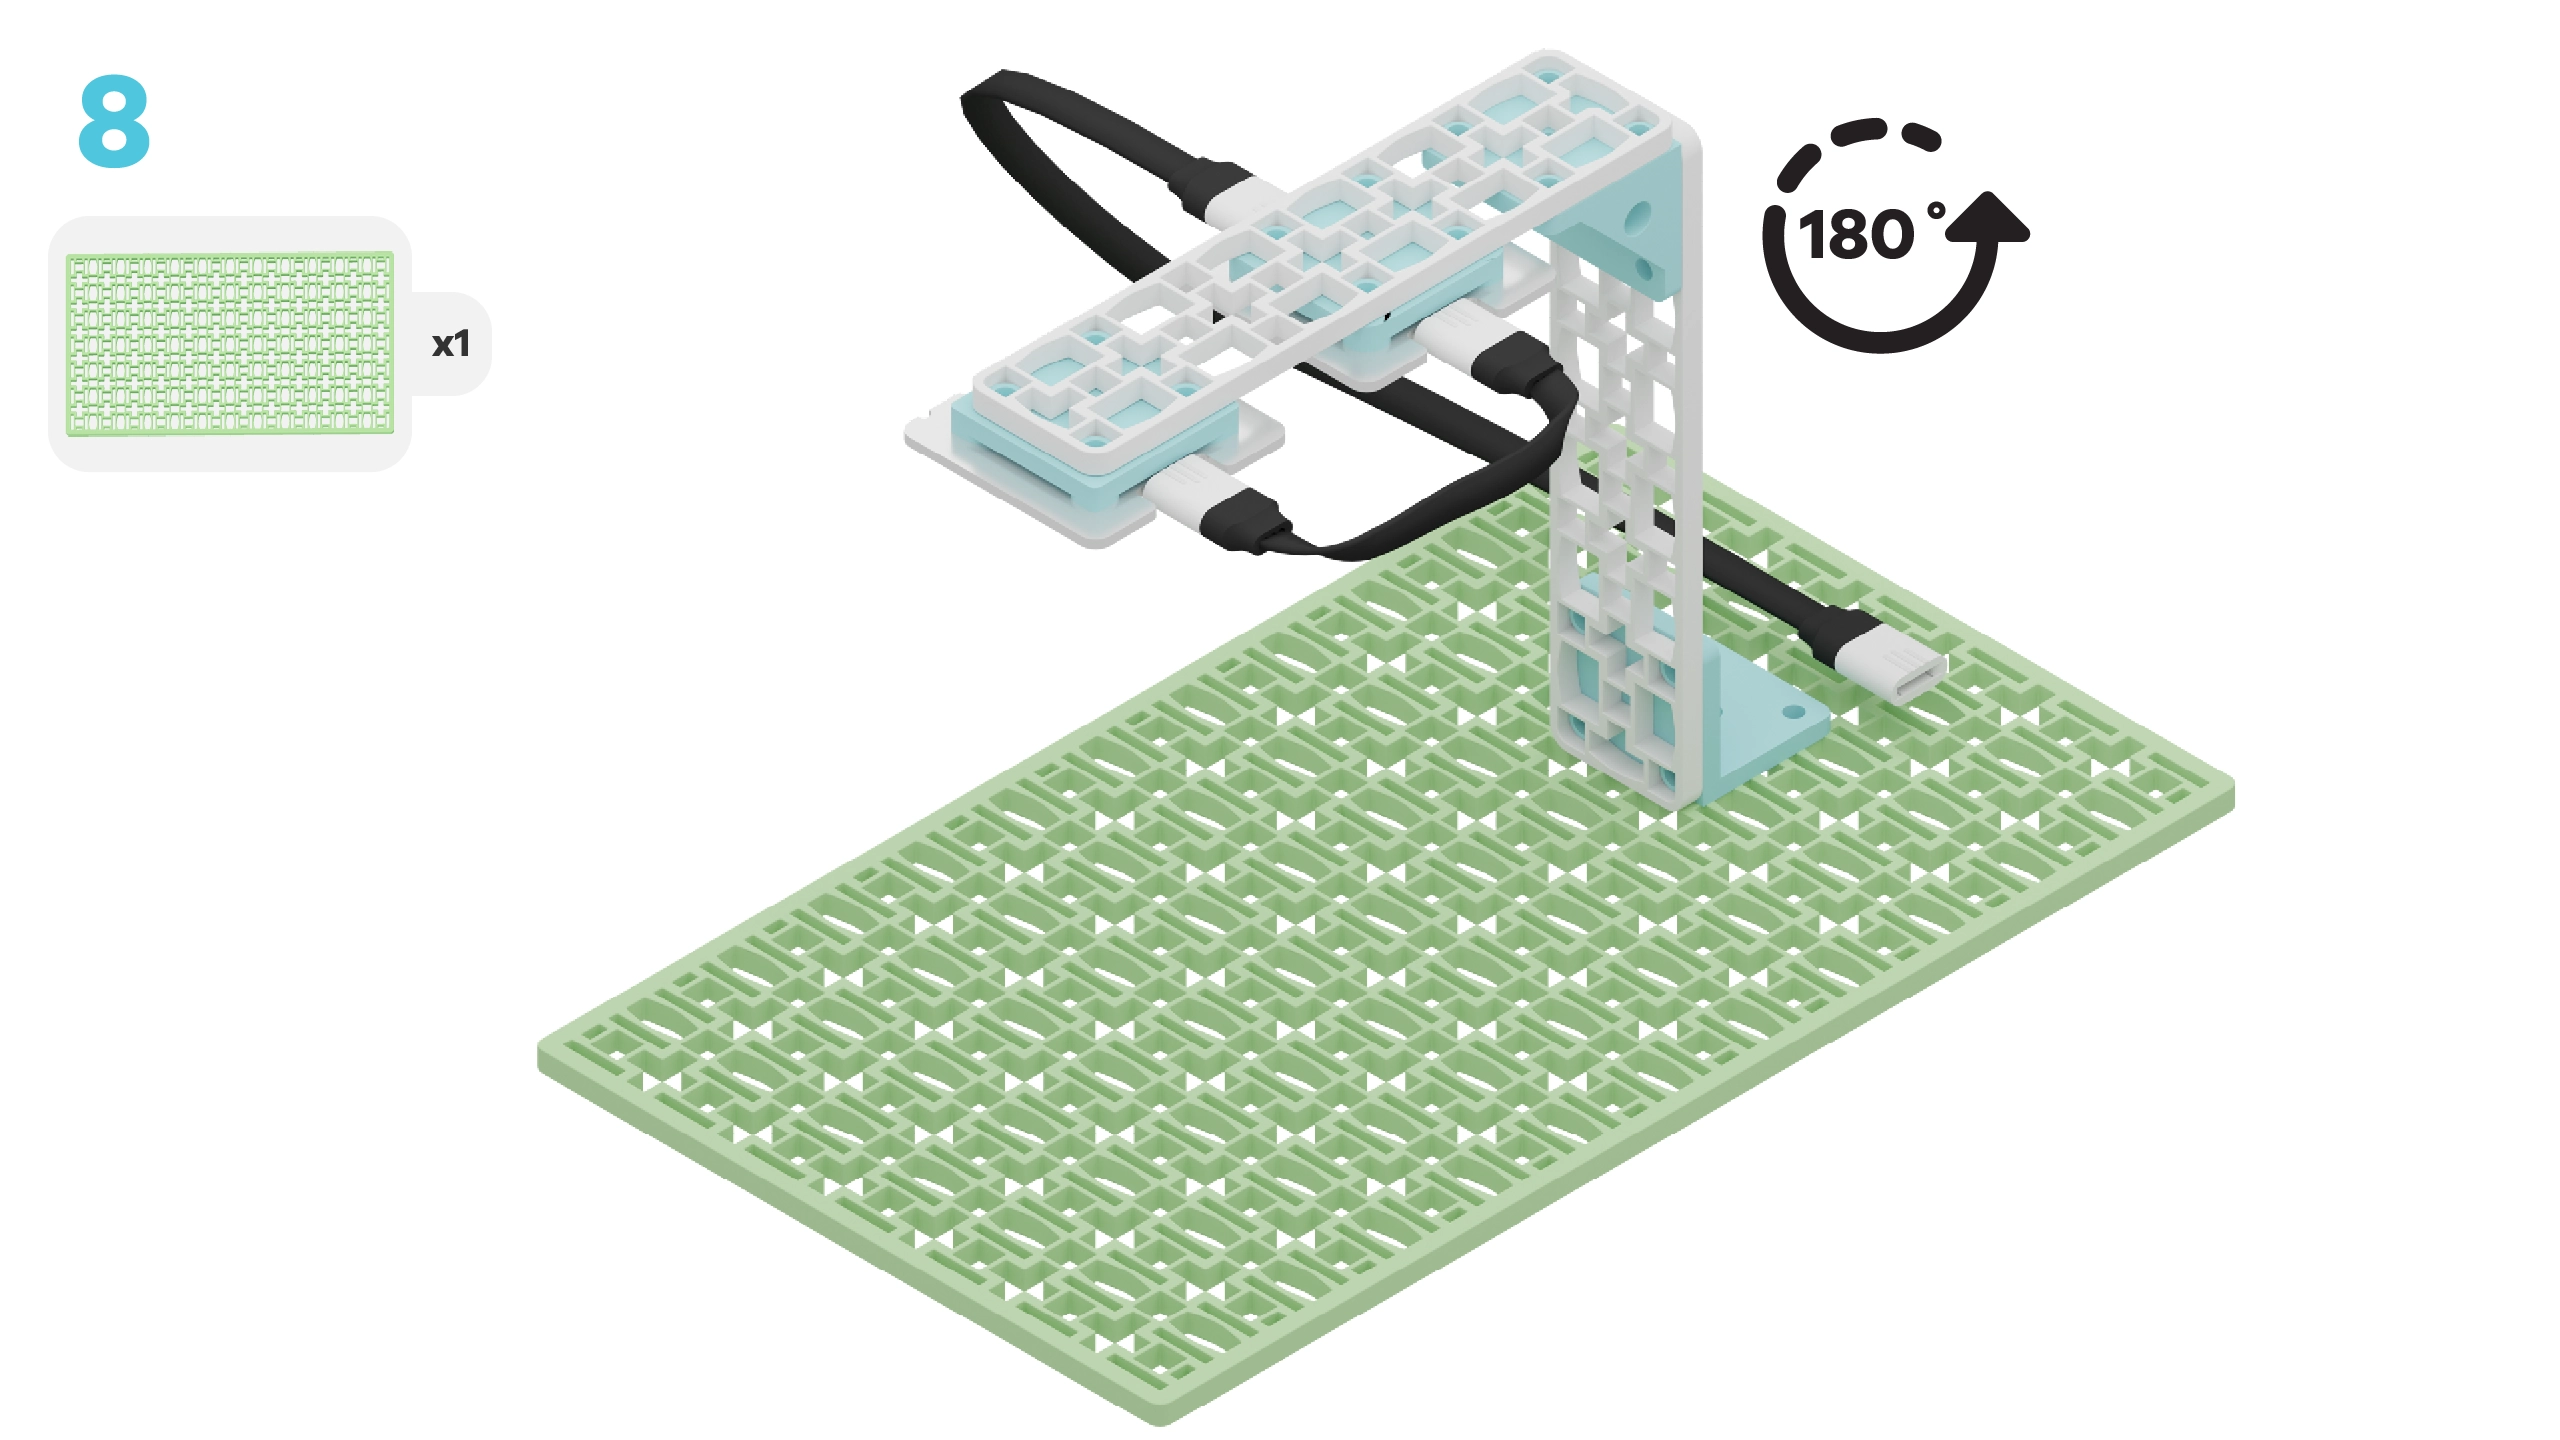
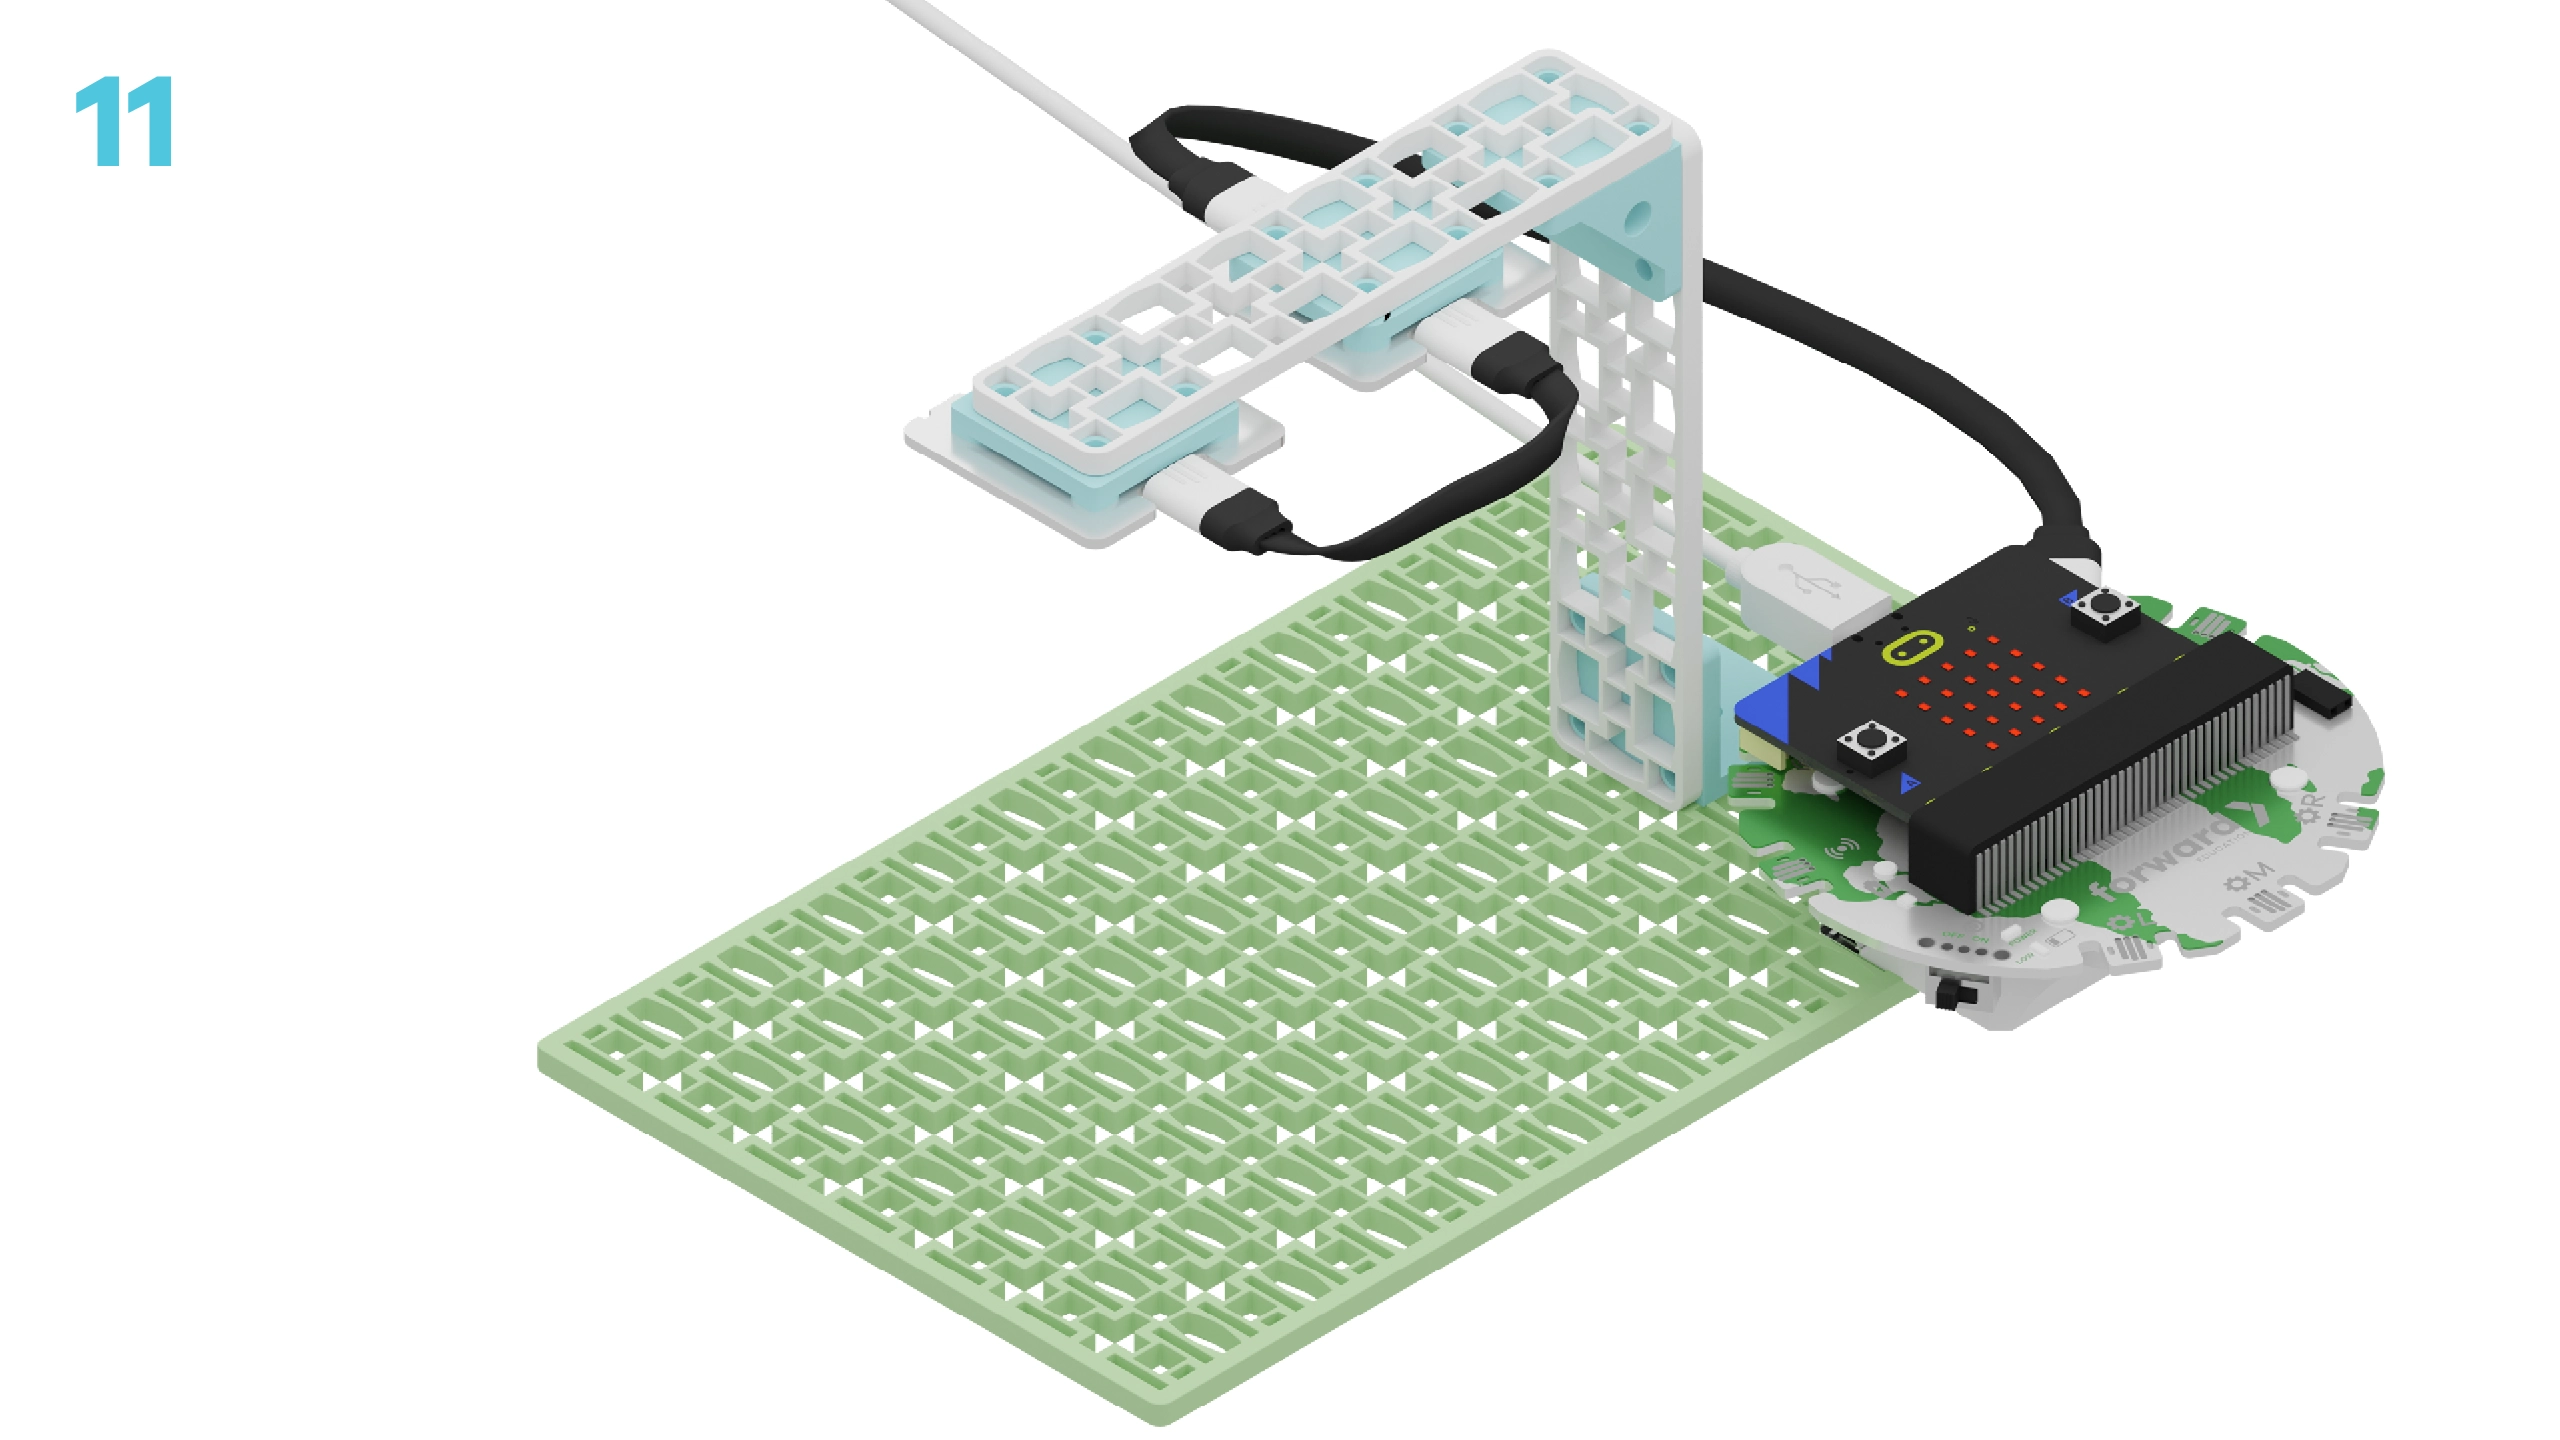
Let's build a glacier satellite! We are going to do this in five parts:
- Build your satellite
- Add code to your satellite to bring it to life
- Modify the code of your satellite to learn how it works
- Complete a couple small coding challenges
- Conduct an experiment to better understand the impact climate change has on Earth's albedo
Before you begin, make sure you have some white and black paper. You'll also need some small rectangles of white paper, folded in half. These will represent our glaciers.
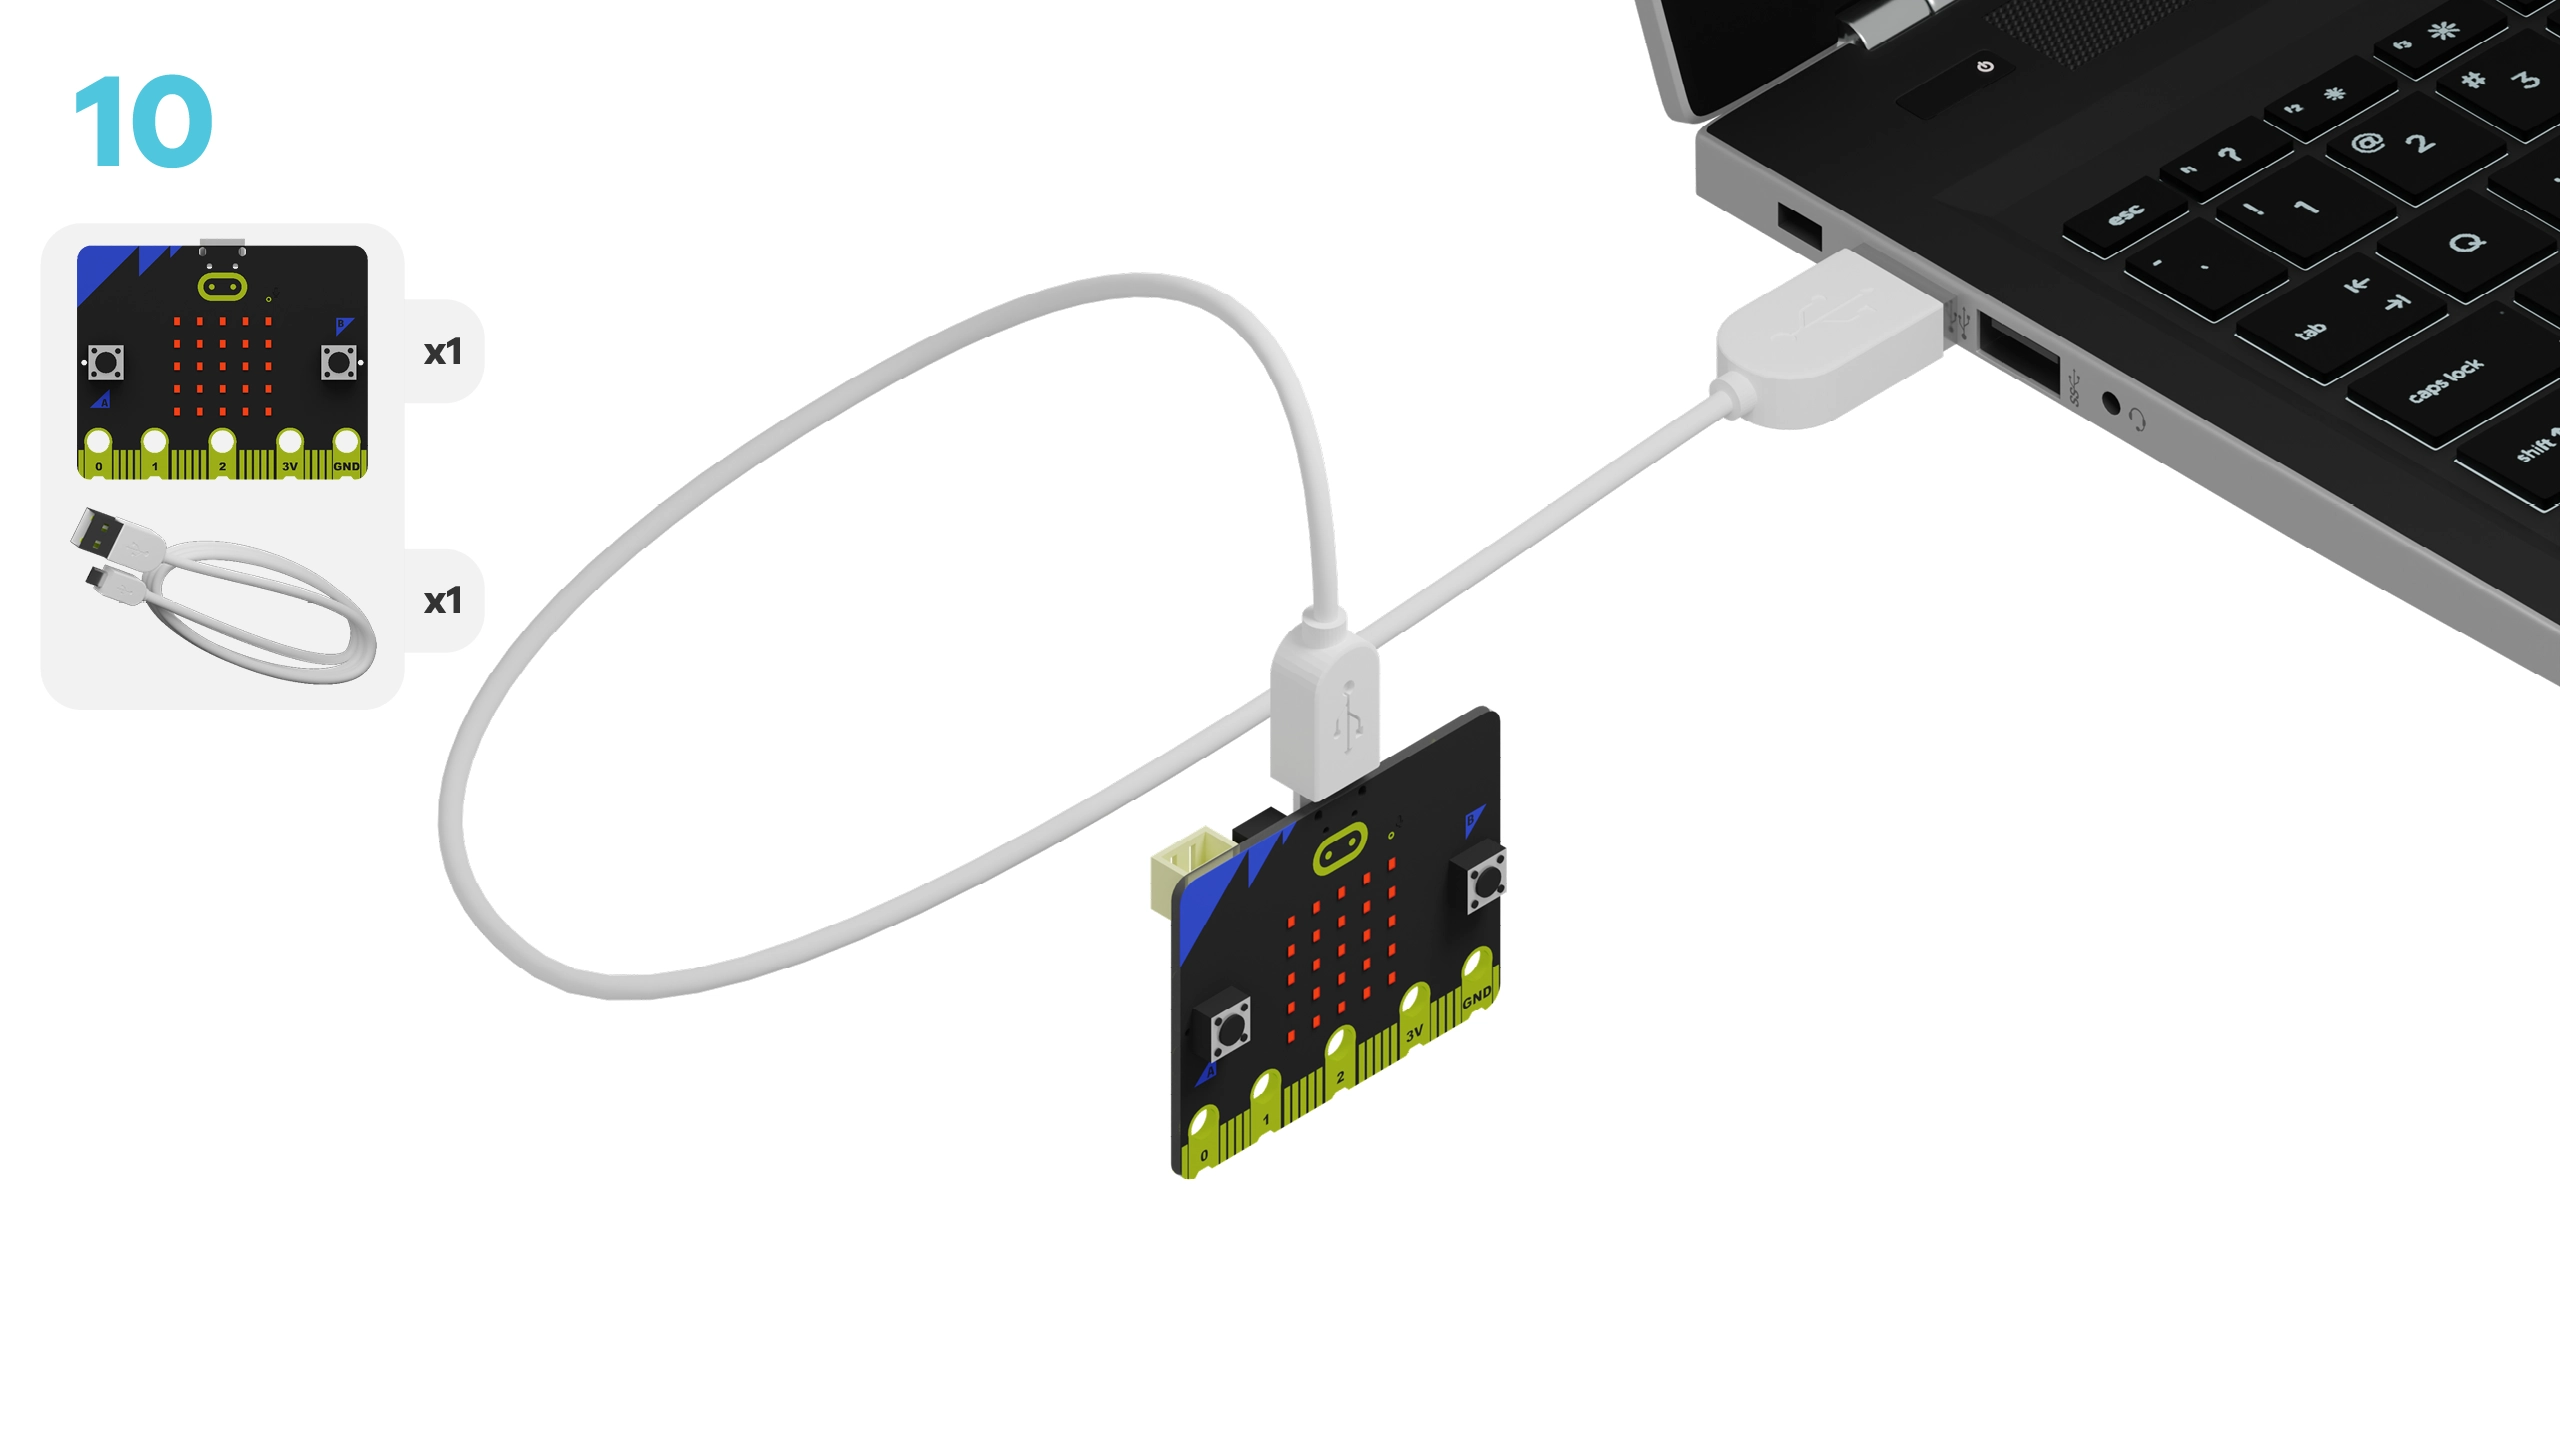
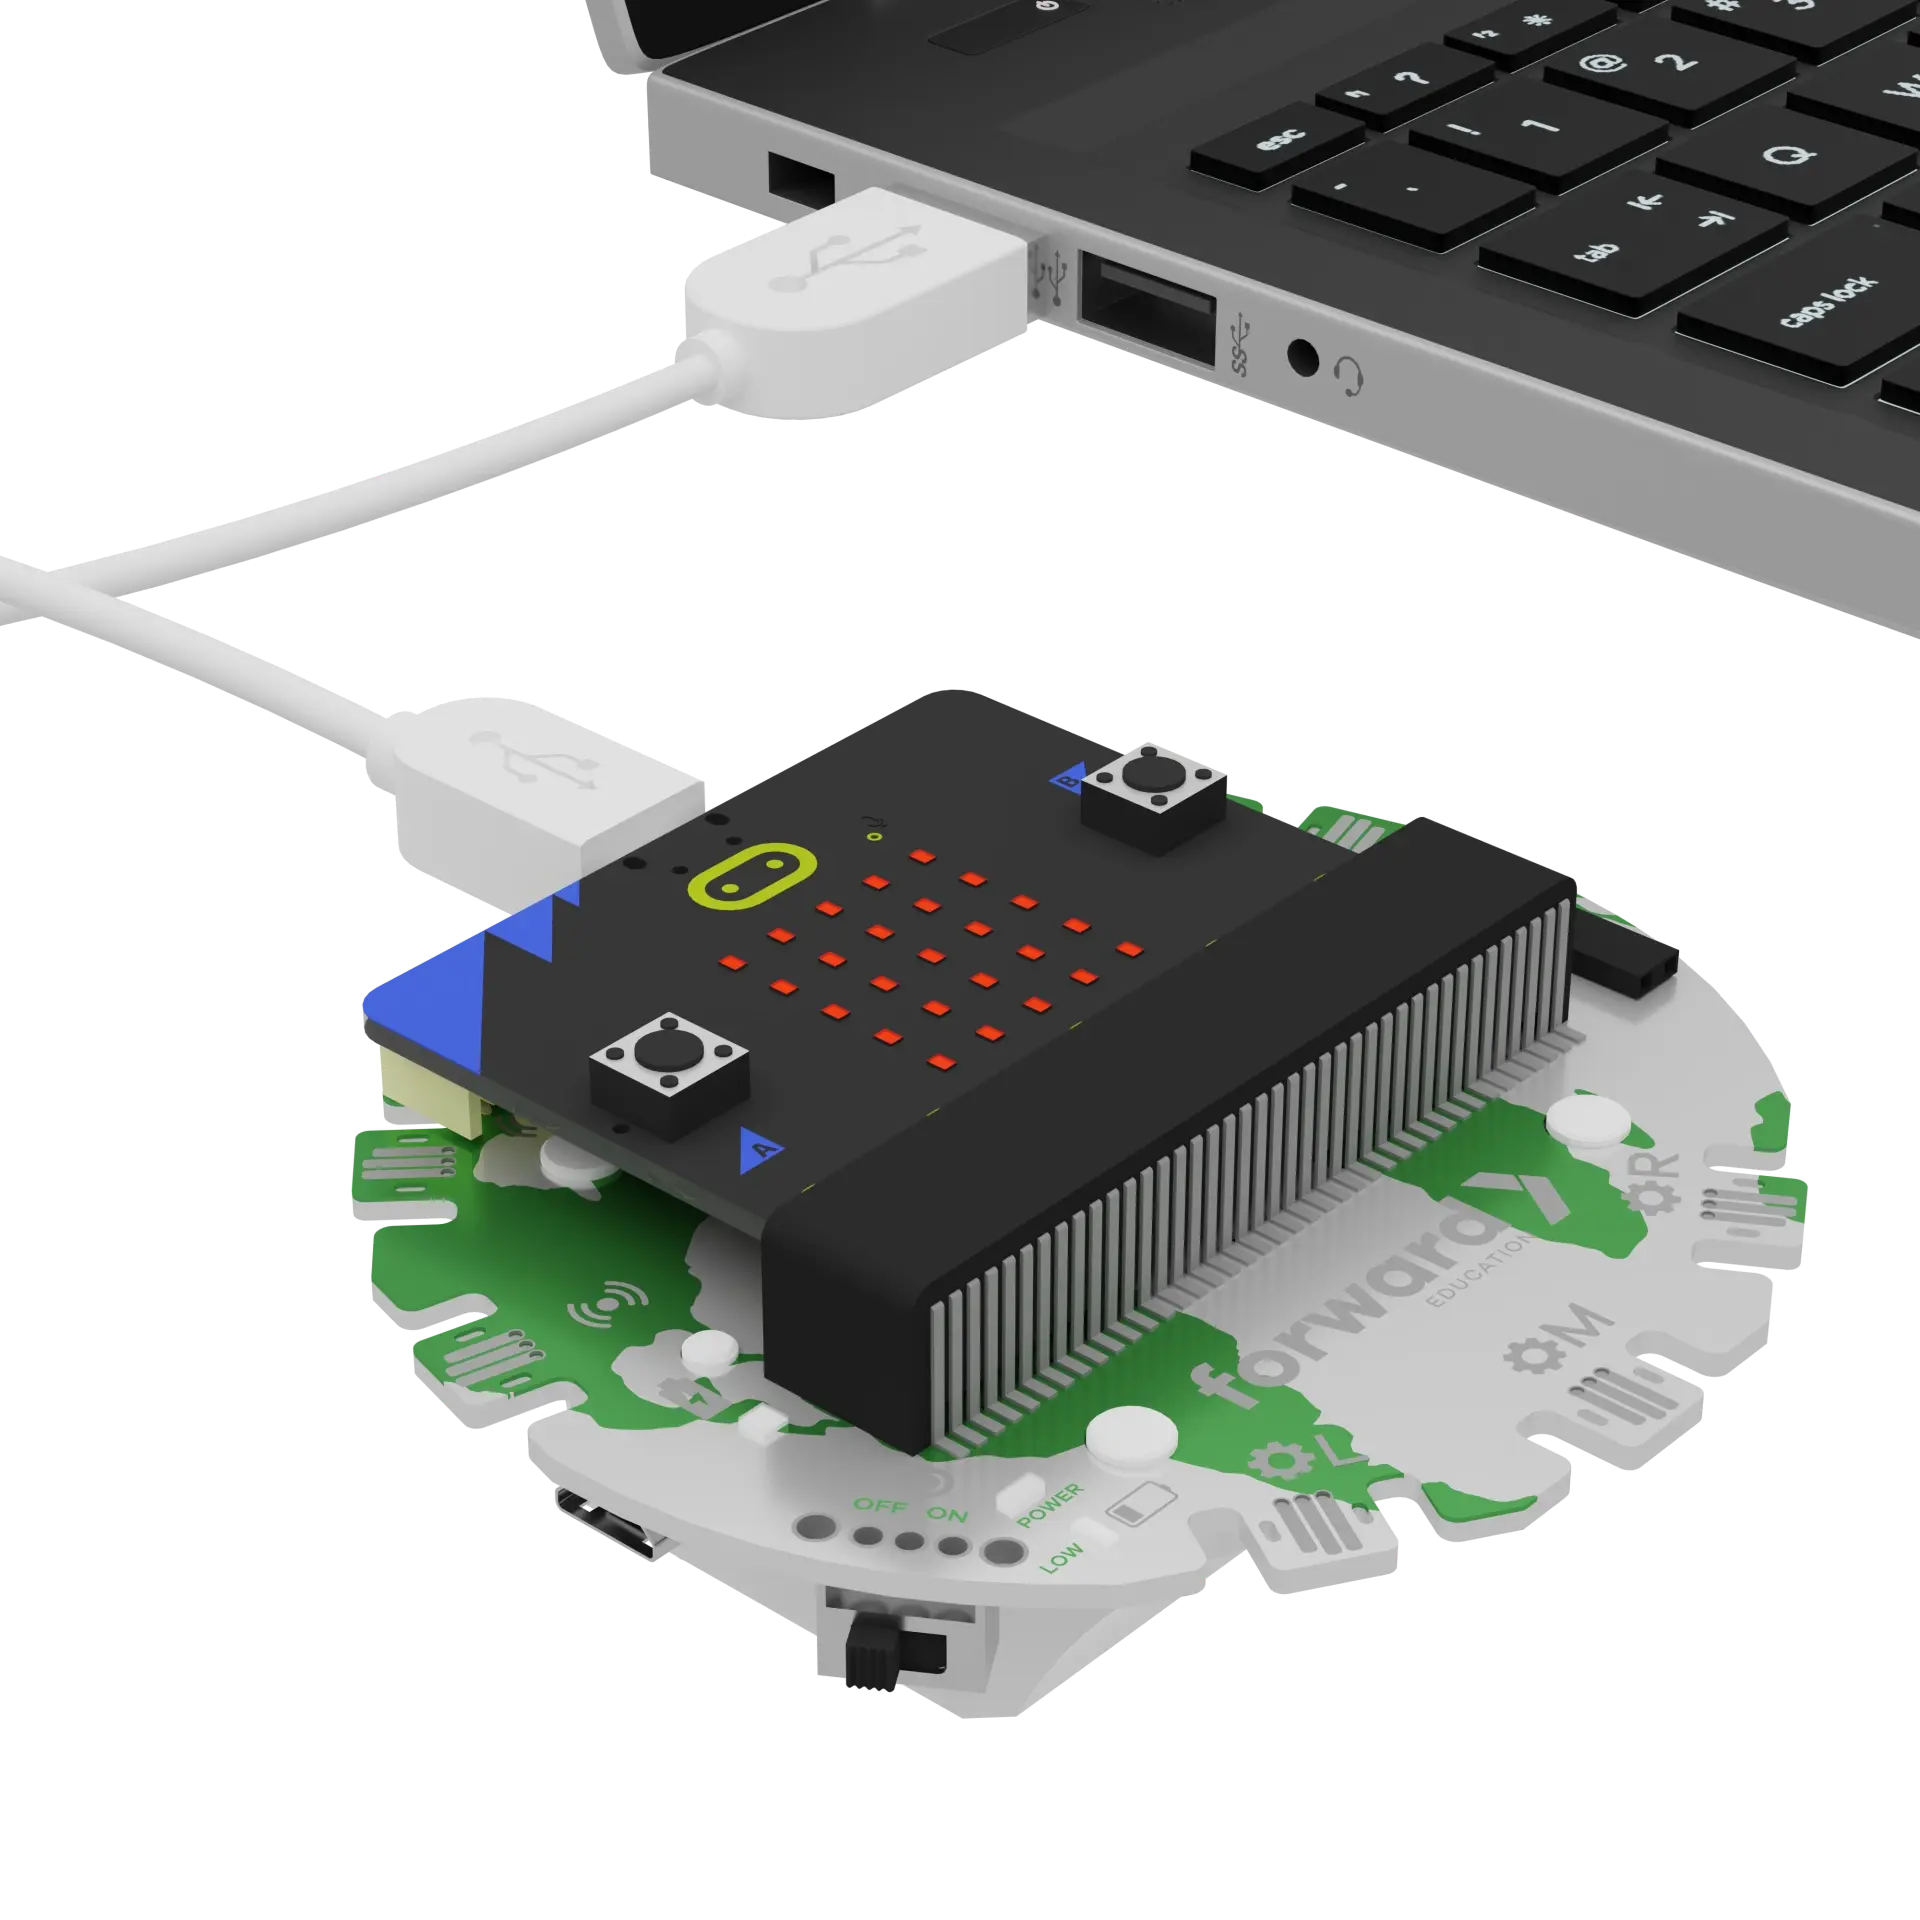
We need to connect our project to the computer to make it come to life with code!
The code will be the instructions that tell our micro:bit what to do.
IMPORTANT! Make sure your Climate Action Kit Breakout Board is turned on and your micro:bit is plugged into your computer.
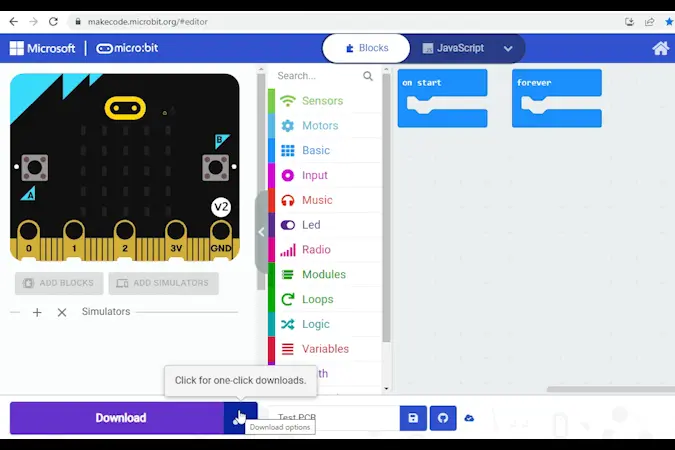
Click the three dots beside the |Download| button, then click on Connect Device.
Next, follow the steps to pair your micro:bit.
Next, click the |Download| button to download the code to your project.
We are now ready to modify our satellite!
Tips
- Follow the instructions at the top of the screen.
- When you are ready for more information, click 'Tell me more!'
- If you need help with the code, click the lightbulb!
- After each change, you will need to
|Download|the updated code to your micro:bit.
Let's take a look at our glacier satellite.
What are the different parts of this project? How will these parts work together to track the amount of light being reflected off different surfaces?
~hint Tell me more!
- In this project, the LED ring acts like the sun and shines light down on the base plate which acts as Earth's surface.
- We will place different coloured paper on the base plate to represent different surfaces, like a glacier, the ocean, the ground, etc.
- The solar sensor will act as our satellite and will measure the amount of light being reflected off Earth.
- This data will give us information on glacier melting. hint~
We will be collecting data on light levels using something called a conditional statement. Can you find the conditional statement in our code?
Check the lightbulb for the answer.
~hint Tell me more!
- Conditional statements tell our micro:bit what to do when a certain condition is met.
- In this case, we are using a conditional statement to tell our micro:bit to collect solar sensor data when the B button is pressed. This is known as user input. hint~
    if (input.buttonIsPressed(Button.B)) {
        datalogger.log(datalogger.createCV("Light Level (%)", fwdSensors.solar1.fwdLightLevel()))
    }
Let's change when our micro:bit collects data by changing ||input:on button B pressed|| to ||input:on button A pressed||.
~hint Tell me more!
- Don't forget to download your new code! hint~
    if (input.buttonIsPressed(Button.A)) {
        datalogger.log(datalogger.createCV("Light Level (%)", fwdSensors.solar1.fwdLightLevel()))
    }
Let's try collecting some data.
Unplug the micro:bit from the computer, then press and hold 'A' for 10 seconds. The collected data will be stored on our micro:bit.
Time to view the data we just logged. To access it:
- Plug the micro:bit back into your computer.
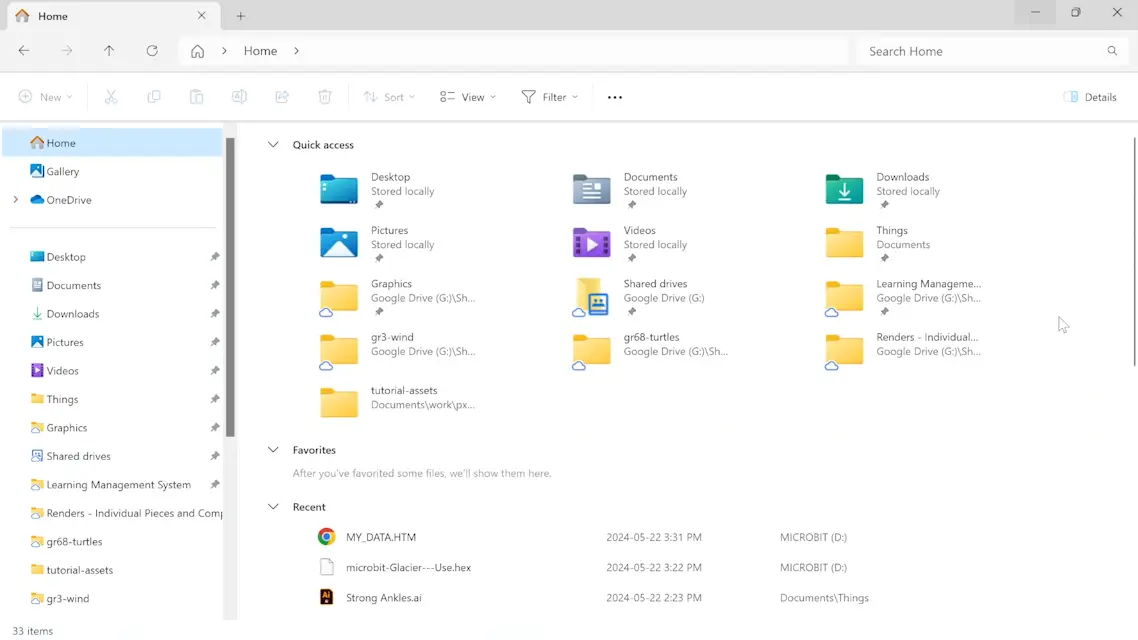
- Open File Explorer or My Computer on your device.
- Select your micro:bit.
- Open the file called 'MY_DATA'.
- A new window will show all your data!
- Click 'Visual Preview' to view as a graph, where the Y-axis is 'Light Level' and X-axis is 'Time (seconds)'.
Complete these steps, then come back here for a challenge.
Need more support? Check out this micro:bit resource on Data Logging.
Let's improve the user experience of our glacier satellite. We are going to:
- Add visual output to tell the user when data is being collected
- Use a conditional statement to delete old data
As a user, we had to trust that our data had been saved. We could only confirm this had actually happened once we opened the MY_DATA file.
Let's add some visual sign or output on our micro:bit's display to reassure the user that data is being collected.
Drag a ||basic:show icon|| block from the ||basic:Basic|| category and add it to the workspace.
If we want the icon to appear while data is being collected, where should we put this block in our code?
~hint Tell me more!
- You will add the
||basic:show icon||block right before the||datalogger:log data||block inside the conditional statement. - Feel free to change the icon.
- Download your code and test it out! hint~
    if (input.buttonIsPressed(Button.A)) {
        basic.showIcon(IconNames.Yes)
        datalogger.log(datalogger.createCV("Light Level (%)", fwdSensors.solar1.fwdLightLevel()))
    }
You probably noticed that the icon stays visible all the time now! That's because we haven't told the micro:bit what to display when A is not being pressed.
Expand your conditional statement by clicking the + icon below it. This reveals an ||logic:else|| condition. Let's add a ||basic:show icon|| block here, too.
~hint Tell me more!
- If A is pressed, we'll show a checkmark and collect data, else we'll display an 'X' icon.
- Download your code and test it out! hint~
    if (input.buttonIsPressed(Button.A)) {
        basic.showIcon(IconNames.Yes)
        datalogger.log(datalogger.createCV("Light Level (%)", fwdSensors.solar1.fwdLightLevel()))
    } else {
        basic.showIcon(IconNames.No)
    }
We've collected some random data while testing our code, but we don't actually want to save this data. At the moment, there is no way to delete data from our log.
Let's add another conditional statement to clear the data.
First, we need to set up our input, which will trigger our code. Go to the ||input:Input|| section and drag the ||input:on button A pressed|| block into the workspace. Change A to B.
Note: The block will be greyed out.
Next, we need to build another conditional statement. Click on ||logic:Logic|| and drag an ||logic:if true then|| block into the workspace. You'll notice that this block is also greyed out.
How do we connect these two blocks to make something happen when we press 'B'? Also, where should we placed the completed conditional statement in our code?
Think you got it right? Click the lightbulb to check your answer.
~hint Tell me more!
- The
||logic:if then||block has a blank space meant for another block. - The
||input:on button B pressed||block is shaped differently and needs to fit inside another block to function. We can insert it into the blank space in our conditional. - Then, place this new conditional within the
||basic:forever||block. This will make our micro:bit continuously checks if the buttons have been pressed. hint~
basic.forever(function () {
    if (input.buttonIsPressed(Button.A)) {
        basic.showIcon(IconNames.Yes)
        datalogger.log(datalogger.createCV("Light Level (%)", fwdSensors.solar1.fwdLightLevel()))
    } else {
        basic.showIcon(IconNames.No)
    }
    // @highlight
    if (input.buttonIsPressed(Button.B)) {
    }
})
Lastly, we need to specify what happens after the B button is pressed. Go to the ||datalogger:Data Logger|| category and add the ||datalogger:delete log|| block inside the ||logic:if then|| block.
~hint Tell me more!
||datalogger:delete log||clears any saved data.- Download your new code.
- Test it out: Unplug your micro:bit, record some data, then clear it by pressing B! hint~
    if (input.buttonIsPressed(Button.B)) {
        datalogger.deleteLog()
    }
Let's see if this worked! Plug your micro:bit back into your computer. Then, open your MY_DATA file to confirm the data log is empty.
Now we are ready to conduct our albedo experiment.
We are going to record the amount of light reflected back to the solar sensor (aka the satellite) in a few scenarios:
- Base plate alone
- White paper (snowy glacier)
- Black paper with four white rectangles (ocean or land with melting glaciers)
- Black paper with three white rectangles
- Black paper with two white rectangles
- Black paper with one white rectangle
- Black paper (dark ocean or land)
How do you think the light level will change in these scenarios? Make a prediction!
Let's start logging some real data. Make sure there is nothing on your base plate. Then, unplug your project from the computer. Next, hold down the A button on the micro:bit for 10 seconds. Let go.
~hint Tell me more!
- We first collect light levels without any paper on the base plate to see what "normal" looks like. This is our control.
- Holding the A button for 10 seconds allows us to gather a lot of data. hint~
Now, grab your white piece of paper and cover the base plate with it. Hold 'A' for 10 seconds. Let go.
~hint Tell me more!
- The white paper represents a healthy, snowy glacier. Glaciers are white and shiny, so they have high albedo and reflect a lot of sunlight back into space. hint~
Take your black piece of paper and add it to the base plate. Then, add the folded white rectangles randomly on top. Hold 'A' for 10 seconds to collect data on this condition.
~hint Tell me more!
- The black paper represents the ocean and ground because it is dark. It has a low albedo and will absorb a lot of light from the sun.
- The white rectangles represent glaciers that are starting to melt. You can start to see the ocean and ground below. hint~
Now, remove one 'glacier' at a time. Each time you remove a glacier, press 'A' for 10 seconds to record data on the new condition.
~hint Tell me more!
- This represents glaciers that are melting over time.
- What do you think will happen to the amount of light reflected back into the solar sensor each time you remove a glacier? hint~
Once all the white rectangles have been removed, take one last measurement of your black paper alone. Hold 'A' for 10 seconds. Let go.
~hint Tell me more!
- This condition represents the ocean or ground without any glaciers. hint~
Let's compare our real data to our predictions.
- Plug the micro:bit back into your computer.
- Open File Explorer or My Computer on your device.
- Select your micro:bit.
- Open the file called 'MY_DATA'.
- A new window will show all your data!
- Click 'Visual Preview' to view as a graph, where Y-axis is 'Light Level' and X-axis is 'Time (seconds)'.
How did the data you collected compare to your predictions?
Can you explain any differences?
In the next step, you can click the |Done| button to finish the tutorial.
