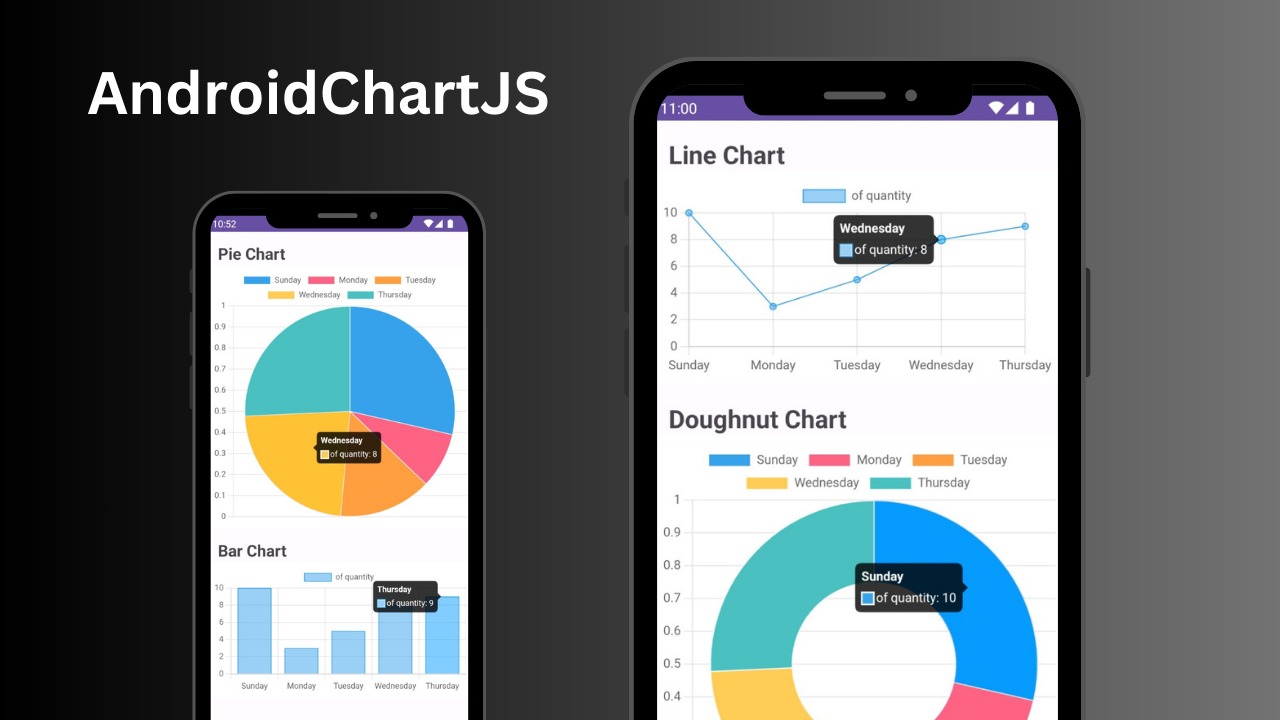
Simplify chart visualization in your Android applications by seamlessly integrating the robust capabilities of Chart.js. Create interactive and visually compelling charts effortlessly, enhancing your data presentation on the Android platform.
Use Gradle. Add it in your settings.gradle at the end of repositories:
dependencyResolutionManagement {
    repositories {
        ....
        maven { url 'https://jitpack.io' }
    }
}
then, add the dependecy in your build.gradle file (Module)
dependencies {
    implementation 'com.github.SeptiawanAjiP:AndroidChartJS:Tag'
}
replace Tag with the latest version.
<?xml version="1.0" encoding="utf-8"?>
<androidx.constraintlayout.widget.ConstraintLayout xmlns:android="http://schemas.android.com/apk/res/android"
    xmlns:app="http://schemas.android.com/apk/res-auto"
    xmlns:tools="http://schemas.android.com/tools"
    android:layout_width="match_parent"
    android:layout_height="match_parent"
    tools:context=".MainActivity">
   <com.dewakoding.androidchartjs.AndroidChartJSView
       android:id="@+id/android_chart_1"
       android:layout_width="match_parent"
       android:layout_height="wrap_content"
       app:layout_constraintLeft_toLeftOf="parent"
       app:layout_constraintRight_toRightOf="parent"/>

</androidx.constraintlayout.widget.ConstraintLayout>binding.androidChart1.setChart(
ChartType.PIE,
arrayOf("Sunday", "Monday", "Tuesday", "Wednesday", "Thursday"),
arrayOf(10, 3, 5, 8, 9),
"of quantity")
// set bubble chart
binding.androidChart1.setBubbleChart(
arrayOf(
BubbleEntity(10,20,30),
BubbleEntity(25, 45, 20),
BubbleEntity(15, 25, 5)
),
"of quantity")- Bar Chart
- Line Chart
- Pie Chart
- Doughnut Chart
- Polar Area
- Radar
- Bubble Chart
