#血色玫瑰
2020年,终将是会被人铭记,载入史册的一年。疫情席卷,我们过了特殊的一个年,终于国内疫情得到了,就在我们觉得可以松一口气时,国外的疫情却又来势凶猛,今天,我们通过几张图表,来简单看看国外疫情的进展情况。
file = './ncov_dxy_to_20200318_abroad.json'
with open(file, 'r', encoding='utf-8') as f:
    jsonGlobal = json.load(f)

file = './ncov_dxy_to_20200318_china.json'
with open(file, 'r', encoding='utf-8') as f:
    jsonChina = json.load(f)
这里有两个文件,一个是国内数据,里面存着每日各个省份和城市的数据,另一个是国家层面的数据,储存着每日各个国家的数据,我们稍微看看这两个数据。(由于篇幅,我省略了部分)
jsonGlobal[0]{'currentConfirmedCount': 52,
'confirmedCount': 68,
'suspectedCount': 0,
'curedCount': 16,
'deadCount': 0,
'comment': '',
'continentName': '亚洲',
'countryName': '越南',
'continentEnglishName': 'Asia',
'countryEnglishName': 'Vietnam',
'updateDateTime': '2020-03-18 22:17:28'
...
}jsonChina[0]{'provinceName': '湖北省',
'provinceShortName': '湖北',
'countryName': '中国',
'countryEnglishName': 'China',
'continentName': '亚洲',
'continentEnglishName': 'Asia',
'provinceEnglishName': 'Hubei',
'currentConfirmedCount': 7751,
'confirmedCount': 67800,
'suspectedCount': 0,
'curedCount': 56927,
'deadCount': 3122,
'updateDateTime': '2020-03-18 22:16:04',
'comment': '',
'cities': [
{'cityName': '武汉',
'currentConfirmedCount': 7442,
'confirmedCount': 50005,
'suspectedCount': 0,
'curedCount': 40073,
'deadCount': 2490,
'locationId': 420100,
'cityEnglishName': 'Wuhan'},
...
]
}OK, 有了直观的体验之后,我们使用pandas来读取
但读取前,我们需要处理下这个字典,转化为Pandas友好的格式,才能正确读取,我写了一个函数,用于提取数据。
def data_request(scope, **kargs):
    if scope == 'China':
        dat = jsonChina
    elif scope == 'Global':
        dat = jsonGlobal
    else:
        raise KeyError(scope+ ' is not a valid argument')

    rv = []
    cities = kargs.pop('cities', False)
    for entry in dat:
        flag = True
        for k, v in kargs.items():
            if entry[k] != v:
                flag = False
                break
        if flag:
            entry = deepcopy(entry)
            entry_cities = entry.pop('cities',None)
            rv.append(entry)
            if cities and entry_cities:
                for cty in entry_cities:
                    entry_ = deepcopy(entry)
                    entry_.update(cty)
                    rv.append(entry_)
return rv这里的scope是一个必须提供的参数,用以确定是提取国内还是国际数据,其他参数可选,比如你想要提取湖北省数据,查看json里的字段,发现是 'provinceName': '湖北省',那么我就可以使用data_request(scope='China',provinceName='湖北省')来提取,此外我还实现了一个cities,用以提取省份内各个城市的数据。
比如我现在来提取一下全球的数据,然后转化为DataFrame看一下
datGlobal = data_request(scope='Global')
datGlobal = pd.read_json(json.dumps(datGlobal), convert_dates=False)
datGlobal[['continentName','countryName','updateDateTime',
           'currentConfirmedCount','confirmedCount',  'suspectedCount',
'curedCount', 'deadCount' ]]| continentName | countryName | updateDateTime | currentConfirmedCount | confirmedCount | suspectedCount | curedCount | deadCount |
|---|---|---|---|---|---|---|---|
| 亚洲 | 越南 | 2020-03-18 22:17:28 | 52.0 | 68 | 0 | 16 | 0 |
| 亚洲 | 越南 | 2020-03-15 19:24:16 | 37.0 | 53 | 0 | 16 | 0 |
| 亚洲 | 越南 | 2020-03-14 21:32:22 | 37.0 | 53 | 0 | 16 | 0 |
| ... | ... | ... | ... | ... | ... | ... | ... |
| 其他 | 至尊公主邮轮 | 2020-03-07 18:58:02 | 21.0 | 21 | 0 | 0 | 0 |
| 欧洲 | 英国(含北爱尔兰) | 2020-02-28 17:48:58 | 8.0 | 16 | 0 | 8 | 0 |
然后,我们pivot一下,获得一个宽数据格式的表格,在进行一些常规的数据清洗,获得不同的国家每日的确诊人数
datGlobal_pvt = datGlobal.pivot_table(values='confirmedCount', index='date', columns='countryName')
datGlobal_pvt = datGlobal_pvt.drop('中国', axis=1) # delete china, cuz a lot of data is lost
datGlobal_pvt = datGlobal_pvt.fillna(method='ffill') # forward fill
datGlobal_pvt = datGlobal_pvt.fillna(0) # this should fill the NAs at early times when no cases are reported
datGlobal_pvt = datGlobal_pvt.astype(int)
datGlobal_pvt = datGlobal_pvt.sort_values(by=datGlobal_pvt.index[-1], axis=1)  # sort
datGlobal_pvt.tail()| date | 荷兰 | 瑞士 | 英国 | 美国 | 法国 | 韩国 | 德国 | 西班牙 | 伊朗 | 意大利 |
|---|---|---|---|---|---|---|---|---|---|---|
| 2020-03-14 | 804 | 1189 | 798 | 2084 | 3661 | 8086 | 3117 | 5232 | 12729 | 17660 |
| 2020-03-15 | 959 | 1189 | 1140 | 2885 | 4500 | 8162 | 4866 | 7753 | 13938 | 21270 |
| 2020-03-16 | 1135 | 1563 | 1543 | 3700 | 5423 | 8236 | 6671 | 9191 | 14991 | 24938 |
| 2020-03-17 | 1705 | 2269 | 1950 | 4661 | 6633 | 8320 | 7840 | 11178 | 16169 | 29022 |
| 2020-03-18 | 1705 | 2269 | 2626 | 6420 | 7730 | 8413 | 11312 | 13716 | 17361 | 31506 |
来,数据有了,开始舒服地干活吧。
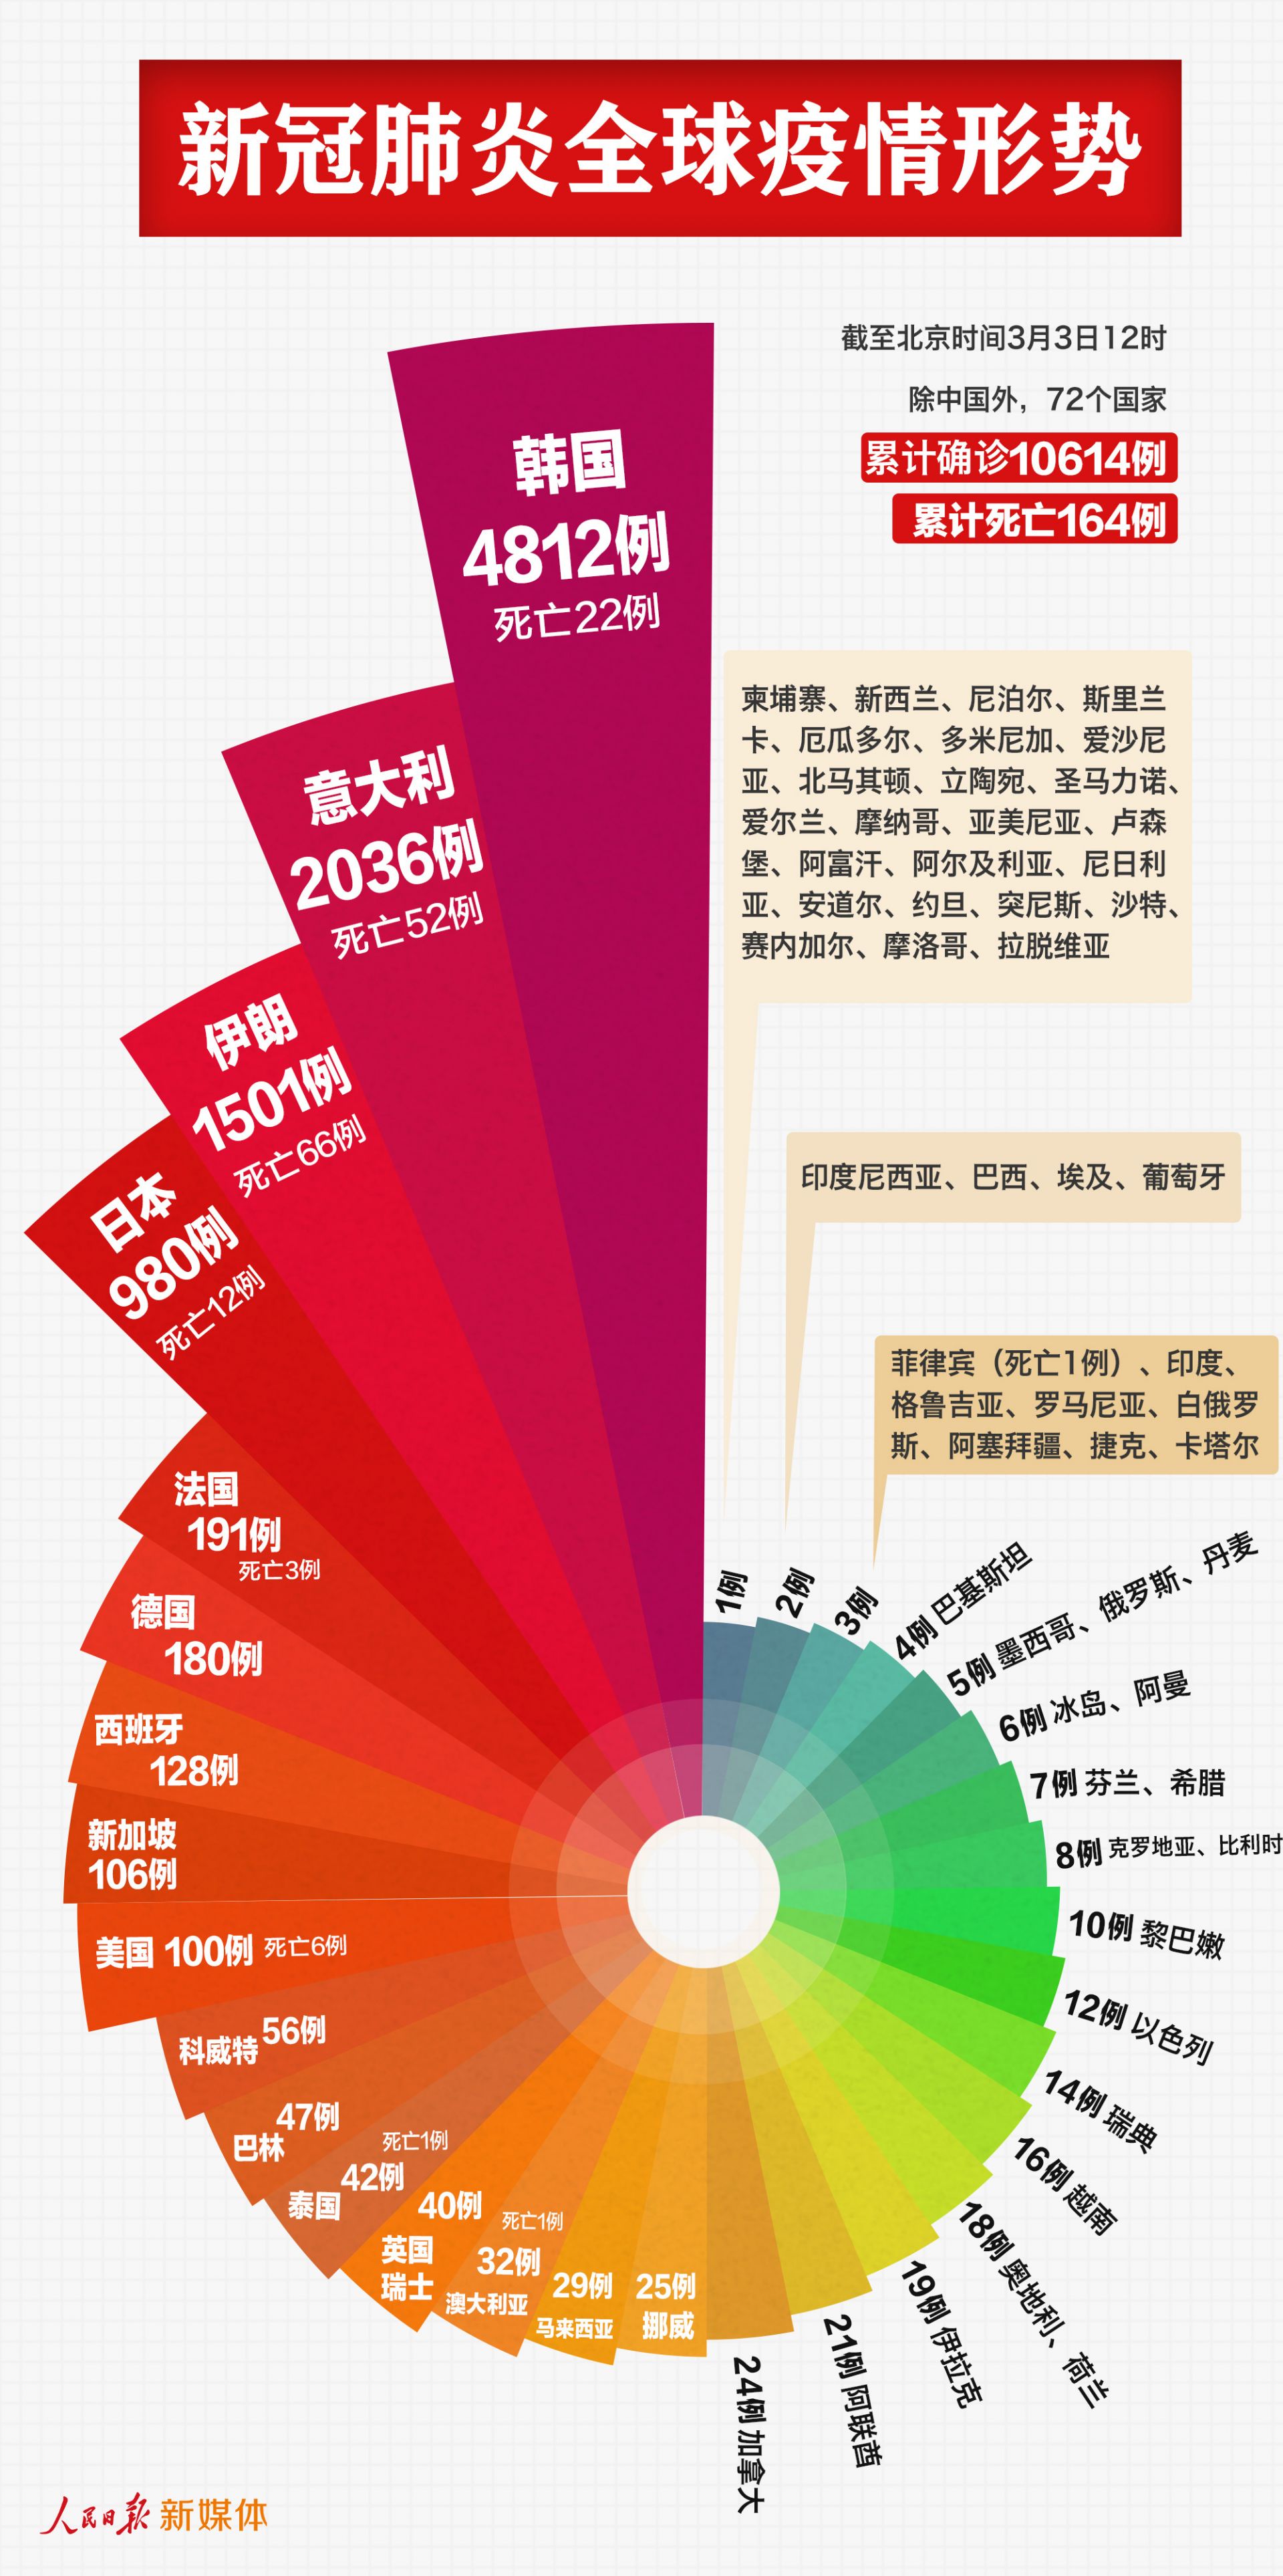
我们要画的是玫瑰图,我们再来看一眼它
这个图有好几个关键点
粗略一思考,这个图其实就是一个极坐标下的柱状,加上颜色和一些文字和一些修饰成分。
所以我们需要处理以下几个问题
- 怎么使用极坐标,并计算好长度和角度
- 怎么给柱子不同的颜色
- 中间的空白 和 两层半透明怎么实现
- 添加文字,这个可以说是最难 最繁琐的
使用python下的matplotlib包,极坐标简直so easy
fig = plt.figure(figsize=(6,8))
ax=fig.add_subplot(projection='polar')#极坐标
然后我们思考一下这个数据,其实我们只需要最新的数据,所以取最后一行就可以了,这里我们取确诊数top 40的国家
此外,我们还需要log一下真实的病例数,缩小数据间的差距,如果数据差距太小,也可以像我一样适当调整
pdat = datGlobal_pvt.iloc[-1,-40:]
pdat = pd.DataFrame({'value':pdat, 'len':1.2 ** np.log2(pdat+1)})
这时候 这个len就是我们极坐标的每个柱子的长度,
那么角度呢?
角度更简单,我才用平均分布的方法,360度平均分给每个柱子,然后计算每个柱子的中心线所对应的角度,如下:
l = pdat['len']
N= pdat.shape[0]
width= 2*np.pi/N
rad = np.cumsum([width]* N) - width/2
颜色也好办,我们使用matplotlib的colormap,然后就可以利用值取出对应的颜色, 比如先用红色的渐变
cm = mpl.cm.get_cmap('Reds')
colors = cm((rad - rad.min())/ (rad.max()-rad.min()))
好, 我们用这个len,和算出来的rad, colors作图
ax.bar(rad,l,width=width, color=colors, alpha=1)中央空白的有以下几种办法:
- 直接画一个白色的圆
- 坐标轴的ylim,左边可以设置到-1
ax.set_ylim(-1,np.ceil(l.max())+1)半透明也好搞
- 直接画两个半透明度的圆,叠在图上
ax.bar(rad,1,width=width,color='white', alpha=0.3)
ax.bar(rad,1.5,width=width, color='white', alpha=0.2)恭喜你看到这里,你离成功已经很近了, 文字处理太繁琐了,我丢个代码,大家自己琢磨吧, 自己折腾折腾比什么都有用
def rose(pdat):
# 玫瑰图
    N= pdat.shape[0]
    width= 2*np.pi/N
    rad = np.cumsum([width]* N) - width/2
    l= pdat['len']
    cm = mpl.colors.LinearSegmentedColormap.from_list('cmap',
            ['#66BB55','#d6dd01', '#EE0000','#660303'], 256)
    colors = cm((rad - rad.min() )/ (rad.max()-rad.min()))

    txt_settings = {
            'span':{0:0.5, 1:0.5, 2:0.5, 3: -0.5},
            'color':{0:'black', 1:'black', 2:'black', 3: 'white'},
            'rot_adj' : {0:-90, 1: -90, 2: 90, 3:90},
            'ha':{0:'right', 1: 'right',2:'left',3: 'right'}
            }

    txt_label = ['{} {}'.format(x, y)
                 for x, y in zip(sdat.index, sdat['value'])]

    fig = plt.figure(figsize=(6,8))
    ax=fig.add_subplot(projection='polar')#极坐标图绘制

    ax.set_ylim(-1,np.ceil(l.max())+1)
    ax.set_theta_zero_location('N')#设置极坐标的起点(即0度)在正上方向
    ax.grid(False)
    ax.spines['polar'].set_visible(False)#不显示极坐标最外的圆形
    ax.set_yticks([]) # 不显示坐标间隔
    ax.set_thetagrids([])

    bars=ax.bar(rad,l,width=width, color=colors, alpha=1)
    ax.bar(rad,1,width=width,color='white', alpha=0.3)
    ax.bar(rad,1.5,width=width, color='white', alpha=0.2)

    txts=[]
    for i in np.arange(N):
        direc = rad[i]//(np.pi/2)
        t = ax.text(rad[i],
            l[i]+txt_settings['span'][direc] ,
            txt_label[i],
            rotation=rad[i] * 180 /np.pi + txt_settings['rot_adj'][direc],
            color= txt_settings['color'][direc],
            ha = txt_settings['ha'][direc], va='center',
            rotation_mode='anchor',  # this parameter is a trick
            alpha=1,
            fontweight='bold', size=8)
        txts.append(t)

    return ax, bars, txts


# 调用作图
ax, bars, txts = rose(sdat)
# ax.figure.tight_layout()
ax.set_anchor((0.5,1))
ax.figure.subplots_adjust(left=-1,bottom=-0.3,right=2,top=1)

# 保存
ax.figure.savefig('rose.png', dpi=300)

